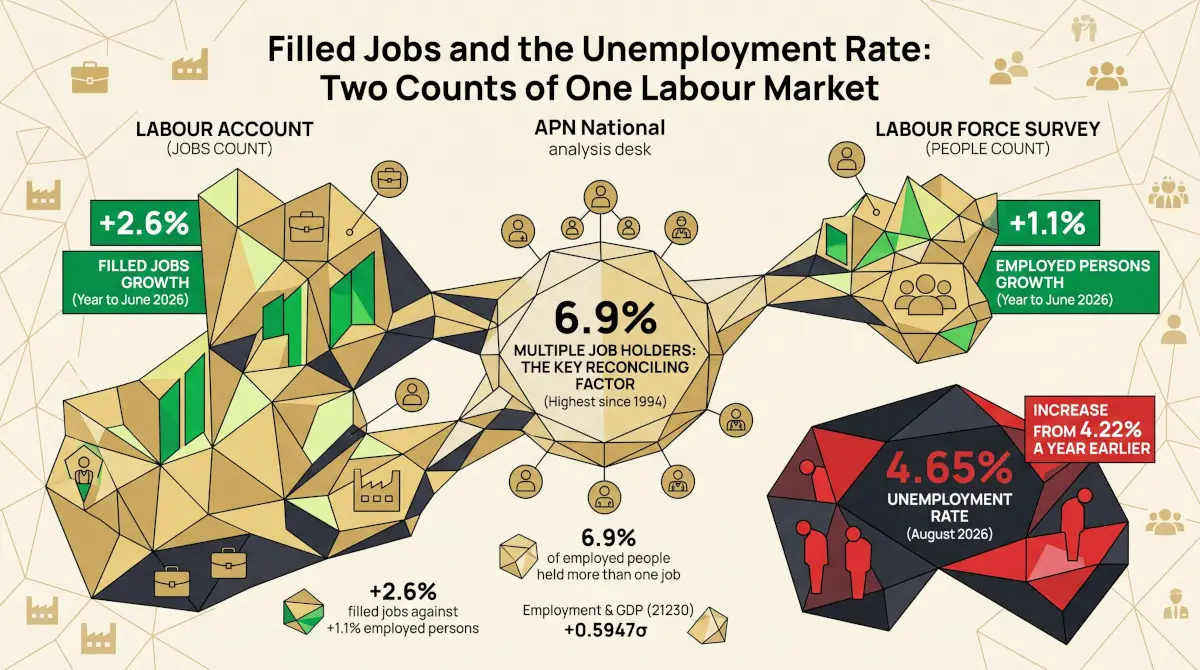
Australia’s unemployment rate averaged 4.43% in the June quarter of 2026, 0.26 of a percentage point higher than a year earlier. Of the 87 regions the ABS reports, 75 recorded a higher rate than a year earlier and 12 a lower one. The average regional change was close to the national rise, but the largest increases were concentrated in Tasmania, the Northern Territory outback and Melbourne’s south-east and west, and the gap between the highest and lowest regional rates widened from 3.70 to 4.41 percentage points.
The σ figure is APN’s certified reading for that condition: how far employment and output sit from their 2011–2025 average, measured in standard deviations. The regional figures in this article are published ABS estimates and are not the node reading.
What these regions are, and how firm the figures are
The ABS publishes labour force estimates for 87 Statistical Areas Level 4, which are regions of roughly 100,000 to 500,000 people. Sydney is split into 15 of them and Melbourne and Brisbane into nine each; the rest of each state is divided into regions such as Geelong, the Riverina or Queensland’s outback.
The ABS produces these regional figures as modelled estimates: it combines the Labour Force Survey with tax and income-support data to reduce the noise in small regional samples. They are not seasonally adjusted, so this article compares each region with the same quarter a year earlier, and all regional figures are three-month averages. Even so, small differences between regions or years may not reflect real change, and rankings separated by a few hundredths of a point should not be read as meaningful. The June quarter 2026 also falls within the ABS’s April to August 2026 modernisation of the Labour Force Survey, and the ABS notes that outputs other than the headline estimates are affected over that period and advises caution in interpreting short-term changes.
A modest national rise
Nationally the unemployment rate has risen from its low of 3.49% in the December quarter of 2022 to 4.43%. It remains below its average since 2011 of 5.12%, and below the levels of the mid-2010s, when it reached about 6.25% in late 2014.
Unemployment rate, Australia, quarterly, %, 2011–2026
Source: ABS Labour Force, Australia, unemployment rate, seasonally adjusted, averaged to quarters. The dotted line is the average across the period shown.
Where the rise landed
Tasmania accounts for four of the ten largest increases. Hobart rose 1.47 points over the year, to 5.23%, the largest move of any region. Launceston and the North East rose 1.17 points, the West and North West 0.89 and the South East 0.86.
The other concentration is in Melbourne. Its south-east rose 0.91 points to 6.22%, its west 0.89 points to 6.54%, and its north-west 0.65 points. Remote regions also moved: the Northern Territory outback rose 1.19 points, the second-largest increase, the Queensland outback 0.78 and Western Australia’s outback 0.71.
At the other end, twelve regions recorded a lower rate than a year earlier, two of them by less than a hundredth of a point, and none by much: the largest fall was 0.21 of a point on the Sunshine Coast, followed by Cairns at 0.12 and Richmond–Tweed at 0.11. Falls of this size are small enough that they may not reflect a real change.
Ten largest increases in the unemployment rate by region, percentage points, year to June quarter 2026
Source: ABS Labour Force, Australia, modelled estimates of the unemployment rate by Statistical Area Level 4, three-month averages. The note gives the June quarter 2026 rate for each region.
The spread between regions has widened
The gap between the highest and lowest regional rates in the June quarter was set out in Two Signals, One Direction. The new point is that it has widened. A year earlier the same two regions sat at the ends of the range, the Queensland outback at 6.08% and Sydney’s Sutherland region at 2.37%; since then the top of the range has risen by far more than the bottom, and the gap has grown from 3.70 to 4.41 percentage points.
High rates are not only a remote-area pattern: five of the eight highest are in or around Melbourne, Brisbane and Sydney, alongside the Queensland, Northern Territory and South Australian outback. The lowest rates are in Sydney’s Sutherland, Northern Beaches and Eastern Suburbs regions and in regional areas such as Warrnambool and the Sunshine Coast.
Highest and lowest regional unemployment rates, June quarter 2025 and June quarter 2026
| June quarter 2025 | June quarter 2026 | |
|---|---|---|
| Highest rate | Queensland – Outback, 6.08% | Queensland – Outback, 6.86% |
| Lowest rate | Sydney – Sutherland, 2.37% | Sydney – Sutherland, 2.45% |
| Gap between them | 3.70 points | 4.41 points |
Source: ABS Labour Force, Australia, modelled estimates of the unemployment rate by Statistical Area Level 4, three-month averages; both quarters from the July 2026 release.
By state, and by capital against the rest
Averaged across each state’s regions, Tasmania rose 1.10 points and the Northern Territory 0.82, against 0.10 in New South Wales, 0.09 in Queensland and 0.09 in South Australia. On average levels, the Northern Territory’s regions are the highest at 5.05% and New South Wales the lowest at 4.07%.
Splitting the regions into capital cities and the rest of each state produces almost no difference: capital-city regions rose 0.25 of a point on average and the others 0.24. Whatever moved the labour market over the past year, it did not divide along that line.
Average change in the unemployment rate by state, percentage points, year to June quarter 2026
Source: ABS Labour Force, Australia, modelled estimates of the unemployment rate by Statistical Area Level 4, three-month averages; each state is the unweighted average of its regions, so it differs from the state rate the ABS publishes. The note gives each state’s average regional rate in the June quarter 2026.
Reading the regional picture
The national rise over the past year is small, and most regions moved with it rather than against it. What stands out is concentration rather than scale: Tasmania’s four regions and Melbourne’s west and south-east recorded some of the largest increases, while Sydney’s three lowest-rate regions changed by 0.14 of a point or less. These are labour market estimates alone; they describe where work has become harder to find, not what has happened to rents or prices in those regions.
Findings are presented on the basis of data and evidence alone.