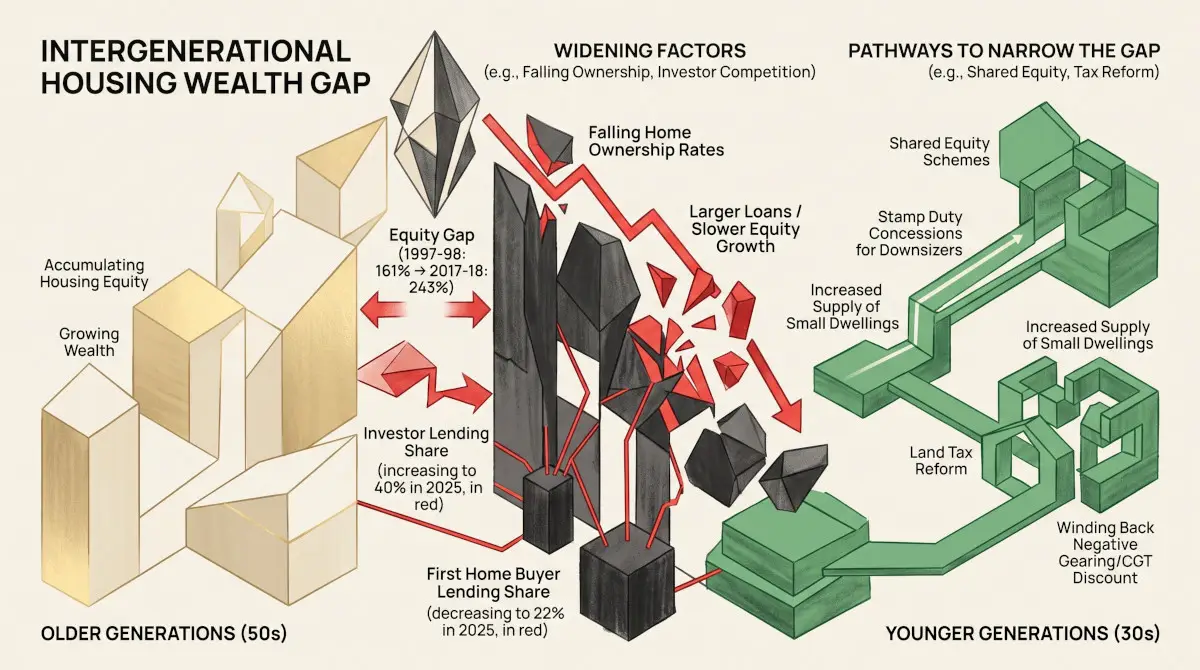
Locked Out: Three Positions from the Senate Inquiry into Intergenerational Housing Inequity
Final report of the Senate Select Committee on Intergenerational Housing Inequity, September 2026, with separate additional comments from the Chair, from Labor senators and from Coalition senators
What is driving the gap in housing outcomes between generations, and what should governments do about it?
Prices, Homes, Migration and Rents: The Senate Housing Inquiry’s Figures Tested (I-261001-152247)
NIL RETURN
23000 Series — Scope & Inclusion Criteria
The Australian Property Network’s (APN’s) 23000 Series is the attributed opinion layer of the APN Codex. It presents the recorded positions of identified participants in the housing debate whose views bear on active node conditions, without constituting APN’s own analytical position. This panel is drawn from the final report of the Senate Select Committee on Intergenerational Housing Inequity, Locked out: the growing generational housing divide, tabled in September 2026 after 185 submissions and eight public hearings. The committee set out shared findings on what has happened but could not agree on what to do about it, so its three sets of additional comments set out the main competing positions in Australian housing policy side by side. Each position is presented as its authors’ own, not as verified fact.
What the Committee Agreed
The committee set out ten findings. Housing has become much harder to afford for younger generations in every form of tenure; younger people are renting for longer, facing higher prices and carrying a greater risk of homelessness; Australia has not built enough public housing; family wealth increasingly decides who can buy; and better data on homelessness, vacant dwellings and short-term rentals is needed. It found that the pressures had accumulated over decades and that they “cannot be attributed to the decisions of any single government” (Chapter 7). It could not agree on a set of recommendations. These come instead from the Chair and from the Labor and Coalition senators in their additional comments.
The Three Positions
Supply alone does not explain prices. The priority is security of tenure, through limits on rent increases and a large expansion of public housing.
Demand shaped by tax and credit settings, investor purchases, land banking, short-term letting and unlimited rent increases also drives prices and rents. Prices have fallen since March 2026 without any sudden change in supply, which shows they respond to financial conditions. Public housing has declined as a share of the system, and the Housing Australia Future Fund is too small and too slow.
- Dwellings up 19% against population up 16% over the past decade
- House prices up 400% since 1999 (Budget Paper No. 1)
- Rents up 43.9% over five years to September 2025, against wages up 17.5%
- Public and community housing at a record low, about 3.7% of the stock
- About 640,000 households with an unmet need for social housing
- 1,432 Future Fund homes complete by May 2026, 670 of them purchased
- Legislate housing as a human right
- Lift public and community housing to at least 10% of the stock within a decade, through a permanent Commonwealth investment mechanism
- A national cap on rent increases at the lesser of 2% or inflation, within and between tenancies
- Proposes that APRA be directed to favour first home buyers, and that the major banks offer a low-rate entry-level mortgage
The problem has built over decades, and the government’s national plan addresses it across supply, ownership, renting, social housing and homelessness.
The 2026–27 changes to the capital gains tax discount and negative gearing level the field for first home buyers. The 5% Deposit Scheme and Help to Buy reduce the deposit barrier. The Future Fund returns the Commonwealth to direct investment in social housing, and higher rent assistance and national rental reforms support renters.
- A $47 billion national housing plan, with a target of 1.2 million homes by mid-2029
- More than 300,000 buyers supported by the 5% Deposit Scheme by May 2026
- Future Fund: 18,650 homes contracted, 1,432 complete, 6,851 under development
- Maximum rent assistance up about 53% since 2022
- Witness modelling of prices 3–5% lower as a result of the tax changes
- Continue the reforms to the capital gains tax discount and negative gearing
- Continue working with the states, territories and community housing providers on social and affordable housing
- Work with the states and territories to implement A Better Deal for Renters nationally
The central problem is a shortage of homes relative to population growth, made worse by taxes, regulation and slow approvals.
Completions have fallen while migration has risen. By the government’s own estimate, the Budget’s tax changes reduce housing supply by 35,000 dwellings over a decade, and the ban on borrowing by self-managed super funds reduces transactions further. Delivery through Housing Australia has been slow, and the growing National Construction Code adds cost to every new home.
- About 170,000 dwellings a year, 30,000 fewer than under the previous government
- Net overseas migration over 292,000 in the year to March 2026, averaging over 390,000 a year since mid-2022 against 176,000 before
- The total value of dwellings fell $34.1 billion (0.3%) in the June quarter 2026
- 1,432 Future Fund homes built against a target of 40,000
- A construction code of more than 2,000 pages, with recent changes adding about $33,000 to an average home
- Reverse the 2026–27 housing tax changes
- Streamline the National Construction Code to core safety and performance requirements, with pattern books and modern methods of construction
- Quarterly public reporting by Housing Australia on spending, projects and costs per dwelling
- Link migration to the number of homes built
Where They Agree, and Where They Divide
They agree on more of the record than the debate suggests. All three accept that the shortfall has built over decades, that younger generations bear the larger share of it, and that more social housing is needed. All three cite the same audited figure for the Housing Australia Future Fund: 1,432 homes complete against a target of 40,000 by mid-2029, drawn from the Australian National Audit Office. They read it differently. The Labor senators describe a program gathering momentum, the Chair one too small and too slow for the need, and the Coalition senators a program that has failed to deliver.
They divide on cause, and so on remedy. For the Coalition senators the cause is a shortage of homes relative to population, and the remedy is lower taxes, a simpler construction code and migration linked to construction. For the Chair the shortage is real but secondary to demand shaped by tax and finance, and the remedy is rent regulation and public investment. The Labor senators place the government’s plan between them, with tax reform on the demand side and the Housing Accord on the supply side. On the 2026–27 tax changes, the three positions are to continue them, to reverse them, and to go further and reinvest the proceeds in public housing.
Also on the Record
The comments draw on evidence given to the committee. A Treasury official told Senate Estimates that the estimated reduction of 35,000 dwellings was small against the two million or more expected over the decade. The Australian Council of Social Service told the committee that only one in eight investor loans finances new construction, and that independent modelling put the price effect of the tax changes at 3 to 5% lower. Westpac’s chief economist, Luci Ellis, is cited by the Chair on recent price falls being larger at the top of the market.
APN Clinical Reframing
The report is written in the register of parliamentary advocacy, and the comments of each side use characterisations of the others’ record that are not reproduced here. In APN’s register, the committee describes sustained and broadening affordability pressure across ownership, renting and social housing, concentrated among younger households. The three positions differ less on the facts than on which facts carry the most weight. The companion National Claim Test puts the figures each relies on against the published series. It finds that house prices have risen more than 400% since 1999, that dwellings have grown slightly faster than the population over the past decade, that completions are about 20,000 a year below their average under the previous government rather than 30,000, that net overseas migration figures are as stated, that the rent comparison depends on whether new or existing rents are measured, and that social housing has fallen to its lowest share of the stock in the series.
The inquiry’s evidence base includes the submission of Professor Rachel Ong ViforJ of Curtin University, published by APN as Why the Housing Gap Between Generations Is Widening, with its own claim test.
This panel is an exploration candidate for Housing Policy (Affordable, Social) (21330), Migration Trends (21250) and Rental Market Analysis (21190). No figure or characterisation in this piece may be treated as an APN-certified position for any 21000, 22000 or 24000 Series node.
Source: Senate Select Committee on Intergenerational Housing Inequity, Locked out: the growing generational housing divide, final report, September 2026 (Parliament of Australia), including the committee’s findings (Chapter 7) and the additional comments of the Chair, Senator Barbara Pocock; of Labor senators Carol Brown and Corinne Mulholland; and of Coalition senators Andrew Bragg and Chris Gatenby. Close paraphrase throughout, with short direct quotations as marked; the tabled report is the authoritative record of exact wording.
Disclaimer
The analysis, information, and opinions contained in this article are for general informational and strategic purposes only and do not constitute financial, investment, legal, or any other form of professional advice. The Australian Property Network (APN) is a strategic intelligence organisation and is not a licensed financial advisor.
The views, thoughts, and opinions expressed in this text belong solely to the author and do not necessarily reflect the official policy or position of the Australian Property Network (APN).
This content may be based on data from third-party sources believed to be reliable; however, APN provides no warranty as to its accuracy, currency, or completeness. Images used are for illustrative and conceptual purposes only and may not represent real persons, properties, or events.
Property values and market conditions can go down as well as up. Before making any property or investment decisions, you must conduct your own thorough research and seek independent professional advice tailored to your specific circumstances.