
The crime figures behind this piece have been corrected, and the piece has not yet been rewritten. Two things changed. Tasmania’s figures had counted offence types that are not counted for any other state or territory, among them property damage, trespass, arson and receiving stolen goods. On the offences counted elsewhere, Tasmania recorded 18,517 property offences in 2022–23, about a quarter fewer than the 24,925 used below, and 5,077 violent offences against the 5,933 used below. And rates for every jurisdiction are now calculated on the ABS estimated resident population at 30 June 2025. Tasmania’s property crime rate is therefore overstated in this piece, and the rankings and the headline rest on the uncorrected figures. A corrected version of this analysis is in preparation.
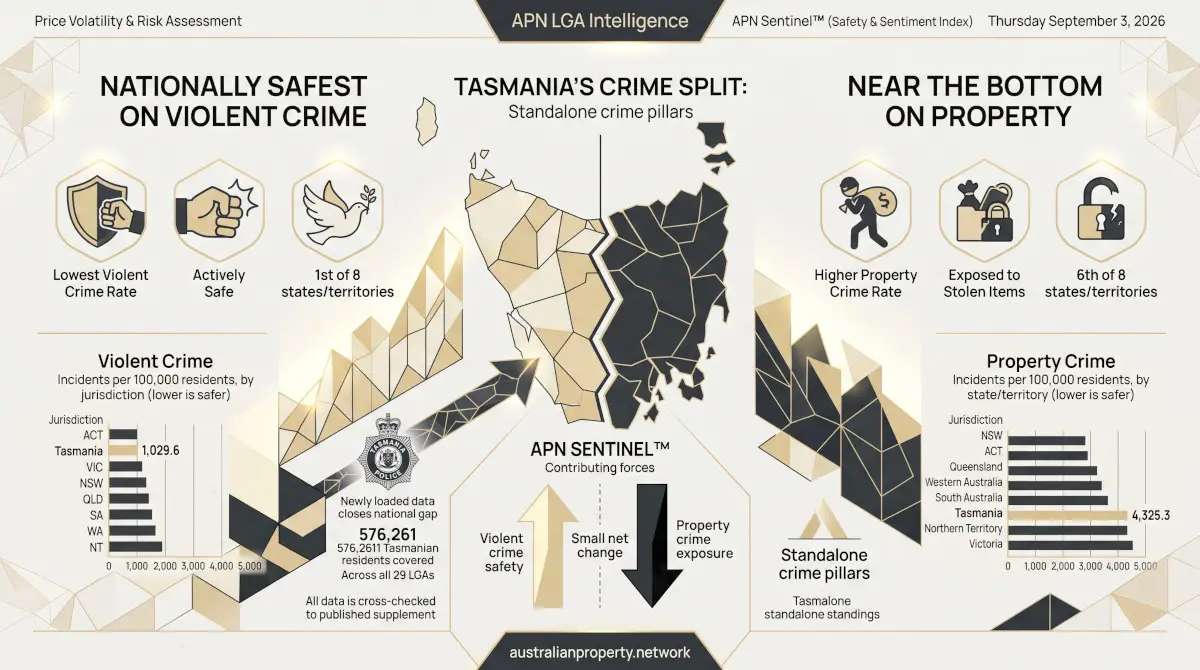
Tasmania’s crime data has been the one gap in APN’s national safety picture since the APN Sentinel™ (Safety & Sentiment Index) launched: every other state and territory had locality-level violent and property crime readings, and Tasmania didn’t. That gap has now closed. Newly loaded Tasmania Police data covering 576,261 residents across the state’s 29 local government areas shows a genuine split: on violent crime, Tasmania’s rate is the lowest of any state or territory in the country. On property crime, it’s third from the bottom, safer than only the Northern Territory and Victoria.
What APN Sentinel™ measures, and where Tasmania fits
APN Sentinel™ is one of five components of the APN Social Capital Index™, alongside Bedrock (economic stability), Meridian (education), Agora (amenity and access) and Substrate (climate resilience). Sentinel itself is built from six components covering crime, civic engagement, housing churn, demographic tension and acute vulnerability. Two of those six, Violent Crime Risk and Property Crime Risk, are the subject of this piece: each converts police-recorded incidents per 100,000 residents at the local-government-area level into a 0–100 national score, where 100 represents the safest locality in the country and 0 the least safe.
Tasmania’s readings come from a Tasmania Police right-to-information disclosure (RTI 115/24, published 2 May 2024), covering the 2022–23 financial year. The incident totals check out exactly against Tasmania’s own published Crime Statistics Supplement for that year: 5,933 violent offences and 24,925 property offences statewide, after excluding a small number of records with no location recorded. Every other state and territory’s reading in this piece reflects the 2024–25 financial year, or the most recent equivalent release, roughly two years more current than Tasmania’s. That gap matters for Tasmania’s overall Sentinel composite score, covered further down: all six of its components are now included, but its crime pillar sits on this older reference period while the rest of the country runs roughly two years ahead.
Violent crime: Tasmania is the safest jurisdiction in the country
At 1,029.6 incidents per 100,000 residents, Tasmania’s statewide violent crime rate is the lowest of any state or territory, fractionally below the ACT’s 1,030.2, a gap of well under one incident per 100,000, effectively a tie for first. Both sit well clear of the next group — Victoria, New South Wales and Queensland, all clustered between 1,220 and 1,295 per 100,000 — and further still from Western Australia (2,586.7) and the Northern Territory, whose rate of 4,885.2 per 100,000 is nearly five times Tasmania’s. On APN’s 0–100 percentile score for this component, Tasmania reads 67.6, second nationally behind the ACT’s 69.1, a fractionally different ordering to the raw rate above, for reasons covered in the methodology note below.
Violent crime, incidents per 100,000 residents, by state/territory (lower is safer)
Source: Tasmania Police RTI 115/24 (FY2022–23, verified to the published Crime Statistics Supplement); APN Sentinel™ locality-level data for all other jurisdictions (2025Q2–2026Q1, or FY2024–25 for South Australia). Rates are population-weighted state averages.
Property crime: a very different picture
Property crime tells the opposite story. Tasmania’s statewide rate of 4,325.3 incidents per 100,000 residents is more than double New South Wales’ 1,814.6 and well above the middle cluster of Queensland, Western Australia and South Australia, all sitting between 3,530 and 3,570. Only the Northern Territory (4,604.1) and Victoria (4,664.6) run higher. On the 0–100 percentile score, Tasmania reads 29.9, again third from the bottom, ahead of only the Northern Territory (24.5) and Victoria (21.9). Combined with the violent crime result, the pattern is unusually clean: Tasmania is close to the best-performing jurisdiction in the country on one crime pillar and close to the worst-performing on the other.
Property crime, incidents per 100,000 residents, by state/territory (lower is safer)
Source: Tasmania Police RTI 115/24 (FY2022–23, verified to the published Crime Statistics Supplement); APN Sentinel™ locality-level data for all other jurisdictions (2025Q2–2026Q1, or FY2024–25 for South Australia). Rates are population-weighted state averages.
Where this leaves Tasmania’s overall Sentinel score
APN Sentinel™ combines six components into a single composite reading for every locality in the country, weighted equally among whichever of the six have data for that locality. Tasmania’s composite now includes both Violent Crime Risk and Property Crime Risk alongside its other four components, on the same basis as every other jurisdiction. On that basis, Tasmania’s population-weighted Sentinel score is 42.7 — fourth-highest of the eight states and territories, behind the ACT, New South Wales and South Australia, and ahead of Victoria, Queensland, Western Australia and the Northern Territory.
APN Sentinel™ composite score by state/territory, 0–100 (higher is safer)
All figures are population-weighted state averages of locality-level APN Sentinel™ readings. Tasmania’s reading includes all six components; its crime-pillar input remains on an older reference period than the rest of the country (see methodology note below).
Tasmania’s strong violent-crime reading and weak property-crime reading substantially offset each other within the composite, keeping the state away from either end of the national range. The clearer story is in the two components individually: Tasmania looks like one of the safest places in Australia to avoid becoming a victim of violence, and one of the more exposed to having something stolen.
What might explain the split
APN’s data does not, on its own, explain why Tasmania splits this way rather than tracking the national pattern of low-density states typically scoring well on both crime pillars together, as Western Australia and the Northern Territory do at the other end of the range. Property crime is generally the more economically sensitive of the two categories nationally, more closely tied to acquisitive theft, break-ins and vehicle crime than to interpersonal violence, so a state with comparatively weaker property crime outcomes but strong violent crime outcomes is not a contradiction; it is a description of what kind of crime problem a place actually has. Tasmania’s is concentrated in property offences.
A methodology note on comparing rate and score
Two figures appear in this piece for Tasmania: a raw rate per 100,000 residents, and a 0–100 national percentile score. These will not always agree to the decimal. A percentile score reflects where a jurisdiction sits in the full national distribution of local-area readings, not simply its own raw number. Two jurisdictions with a raw rate as close as Tasmania’s and the ACT’s (a gap of well under one incident per 100,000) can occasionally order differently on percentile score than on raw rate for this reason. All eight jurisdictions’ percentile scores are computed against the same national comparison set as of 3 September 2026.
Findings are presented on the basis of data and evidence alone.