
The 0.4 Per Cent Question: June Quarter Growth, the September Repricing, and a Housing Forecast Conditioned on Easing
Inflation (21220) +2.1049σ Q2 2026
Interest Rates (21210) +1.0049σ Q1 2026
Employment & GDP (21230) +0.5947σ Q2 2026
Scope and Purpose
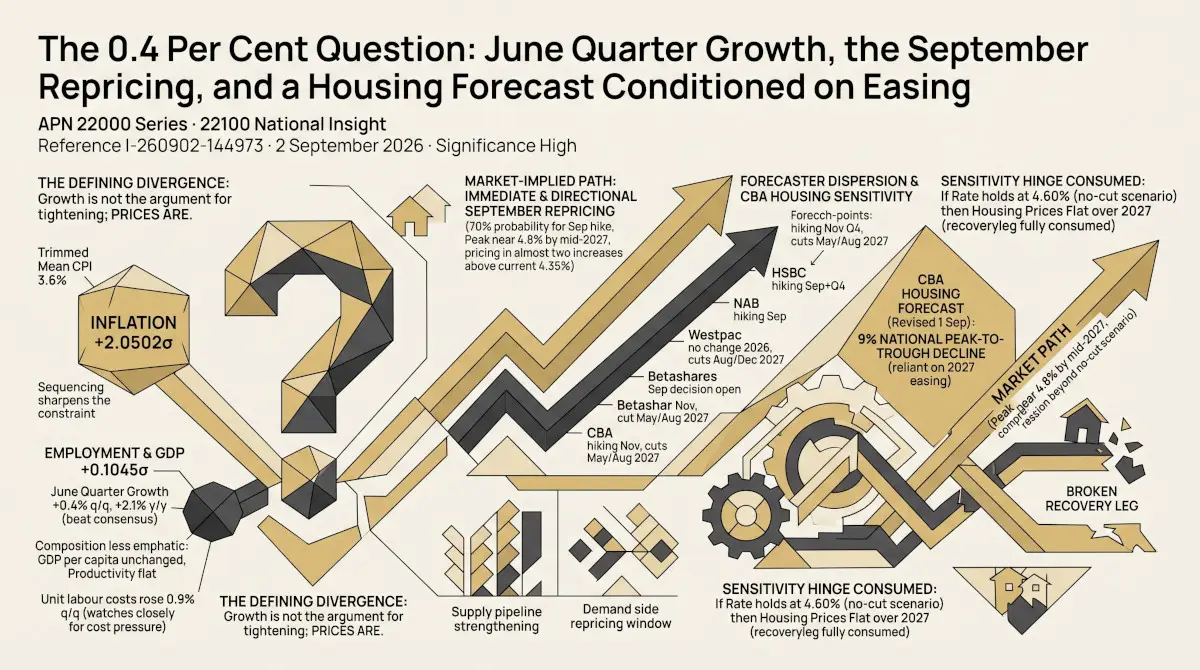
The Australian Bureau of Statistics published the June quarter 2026 national accounts at 11.30am on 2 September. Gross domestic product rose 0.4 per cent in the quarter against a consensus expectation of 0.3 per cent, and annual growth of 2.1 per cent eased from 2.5 per cent in the March quarter while exceeding the 1.8 per cent forecast. The chain volume level of $699,461 million was loaded to Australian Property Network’s (APN’s) Employment & GDP (21230) pipeline the same morning from ABS 5206.0. Within hours, futures pricing for the Reserve Bank’s 29 September cash rate decision had moved to about a 70 per cent probability of an increase, on Bloomberg’s analysis of market pricing as reported by the ABC. This output does three things. It sets out what the quarter actually contained; it maps the repricing of the cash rate path against the published positions of the major forecasters; and it tests the Commonwealth Bank’s newly revised housing forecast — published on 1 September, the day before the accounts, and now anticipating a national peak-to-trough decline of around 9 per cent — against the rate path the market is carrying, because that forecast’s 2027 recovery leg is, by the bank’s own published sensitivity, reliant on rate cuts the market has just priced further away.
What the Quarter Contained
The composition is less emphatic than the beat. GDP per capita was unchanged in the quarter after contracting 0.1 per cent in March, leaving annual per-capita growth at 0.7 per cent. GDP per hour worked — labour productivity — was flat after falling 0.6 per cent in the prior quarter, leaving annual productivity growth at negative 0.2 per cent, and on Indeed’s analysis roughly 5 per cent below its peak. Real unit labour costs rose 0.9 per cent in the quarter, a measure the Reserve Bank watches closely for cost pressure on businesses. On the ABS’s own expenditure decomposition, private investment contributed nothing to growth in the quarter — household consumption (+0.2 percentage points) and public demand (+0.1 points, through government consumption) were the drivers, and the household saving ratio edged up to 6.5 per cent; goods imports rose 2.4 per cent led by cars and aircraft; services imports fell 4.9 per cent as the Middle East conflict disrupted overseas travel; and exports rose 0.8 per cent on higher coal production.
Westpac’s momentum decomposition is the sharpest counterpoint to the headline. On a six-month annualised basis, growth ran at about 1.5 per cent over the first half of 2026, down from about 2.8 per cent in the second half of 2025 — an economy losing momentum even as it prints above consensus — while remaining a touch firmer than the RBA had expected at this point in the cycle, with unit labour costs turning higher in the quarter. An economy losing altitude while its cost base firms is the least comfortable configuration a central bank holding a tightening bias can be handed, and it is the configuration the June quarter delivered.
Real Gross Domestic Product, Chain Volume, Dec 2021 – Jun 2026
Source: ABS 5206.0 Australian National Accounts, June quarter 2026 (released 2 September 2026), loaded to the APN Codex the same day. Quarterly chain volume levels, $ millions, seasonally adjusted. Growth rates quoted in text are ABS-published figures; chain volume growth is not derivable from a simple ratio of levels.
The Repricing of 29 September
The market response was immediate and directional. Beyond the roughly 70 per cent September probability, reported futures pricing now carries a cash rate increase by November as fully priced, attaches about a one-in-five chance to increases at both remaining 2026 meetings, and implies a peak near 4.8 per cent by the middle of next year — almost two increases above the current 4.35 per cent. The distance travelled is worth recording precisely, because the Reserve Bank’s own August minutes record the starting point: at the 11 August meeting, market pricing implied little prospect of a move that month and around half a chance of one further 25 basis point increase by the end of 2026, with most market economists expecting no further increase at all and some expecting cuts over the first half of 2027. Three weeks later the market carries roughly a 70 per cent probability for September alone and an implied peak nearly two increases higher. Pricing has moved from half an increase to nearly two in the space of three weeks, on the July inflation reading and today’s accounts.
Forecaster dispersion has widened rather than narrowed. HSBC moved today from an on-hold position to forecasting increases in September and the December quarter, taking the cash rate to 4.85 per cent, and expects the additional tightening to slow growth to near a standstill around the turn of the year. State Street sees a September increase as probable unless the labour market weakens materially before the meeting. NAB entered the week already forecasting a 25 basis point September increase to 4.60 per cent. Westpac holds the opposite position — no change for the remainder of 2026, then reductions in August and December 2027 taking the cash rate to 3.85 per cent — and Betashares regards the September decision as genuinely open. The Commonwealth Bank sits between the camps: it moved its call in August to a 25 basis point increase in November, taking the cash rate to 4.60 per cent, before reductions in May and August 2027. The country’s largest mortgage lender now carries a further increase in its own baseline — a detail that bears directly on its housing forecast, below.
The Board’s own deliberations frame the September meeting more tightly than any external forecast. The August minutes record that members formally weighed a 25 basis point increase against a hold before deciding — unanimously — to stay at 4.35 per cent, with several members judging it quite possible that upside risks to the inflation forecast would crystallise and require further tightening, and the staff assessing those risks as skewed to the upside. The hold was explicitly conditional: the Board’s closing language committed it to increasing the cash rate target further if upside risks materialise, and members noted that by the following meeting they would hold additional monthly inflation and labour market reports and the June quarter national accounts. Today’s release is not merely context for the September decision; it is one of the named inputs the Board said it was waiting for — and it printed above consensus.
Cash Rate Target and the Forecast Dispersion, Jul 2021 – Dec 2027
Source: RBA statistical table F1 (loaded to the APN Codex; latest daily observation 17 July 2026), extended at 4.35% per the RBA’s published rate effective 12 August 2026. Forecast markers are the published positions of NAB, HSBC and Westpac, CBA’s November increase to 4.60% (followed by forecast reductions in May and August 2027, ending 2027 at 4.10%), and reported futures-implied pricing as at 2 September 2026. Forecasts are their issuers’ own and are not APN projections.
The Inflation Constraint
The asymmetry has a simple source. The July consumer price index rose 3.5 per cent over the year, down from 3.8 per cent in June, but the trimmed mean measure held at 3.6 per cent — unchanged, and above the 2–3 per cent target band, as it has been on the monthly measure since April 2025. The Bank’s own August projection has trimmed mean inflation remaining above 3 per cent until mid-2027 and returning to around the target midpoint only in late 2027, under a technical assumption that the cash rate ends the forecast period near its current level. Sequencing sharpens the constraint: the July release is the final CPI reading the Monetary Policy Board will hold when it meets, because the August data is published on 30 September, the day after the decision. The Board will decide on stale prices and fresh growth, which leaves the August labour force survey, due mid-September, as the last release with a demonstrated capacity to move the pricing. With productivity flat and the trimmed mean at 3.6 per cent, unit labour cost growth at current rates is arithmetically difficult to reconcile with the target band — that, rather than the growth number itself, is what the market repriced.
Trimmed Mean Inflation Against the Target Band, Apr 2025 – Jul 2026
Source: ABS 6401.0 Table 6, monthly trimmed mean annual change, seasonally adjusted (series A130400382R), loaded to the APN Codex. The July 2026 observation is the final CPI reading available to the Monetary Policy Board before its 29 September decision; August data is published 30 September.
What the Certified Telemetry Shows
APN’s certified readings frame the decision more starkly than any single release. Inflation (21220) sits at +2.1049σ against the 2011–2025 anchor for the June quarter — the most stretched reading in the Economic Factors cluster. Interest Rates (21210) reads +1.0049σ for the March quarter, with the cash rate series at 4.35 per cent and the RBA’s indicator retail lending rate at 8.77 per cent. Against those, the activity side of the ledger is firmer than quiet: Employment & GDP (21230) reads +0.5947σ for the June quarter — its GDP level (+1.81σ) and filled-jobs (+2.07σ) components against their trending 2011–2025 anchors, offset by both unemployment components sitting below anchor — while Building Approvals & Commencements (21510) reads +0.0034σ and Household Finance & Consumer Sentiment (21240) reads +0.0144σ, both for the March quarter. The wage price index is running at 3.2 per cent annually — a trailing real-wage deficit of 0.75 percentage points against CPI over the year, though the June quarter itself recorded the first computed real-terms gain in the pairing — and the OECD’s composite consumer confidence reading for Australia stood at −19 in June. A two-sigma inflation node against activity-side readings of +0.6σ and below is the defining divergence: growth is not the argument for tightening; prices are.
One supply-side observation belongs in the record. The June quarter total of 53,952 dwelling approvals, loaded to the APN Codex this morning from ABS 8731.0, sits 13.0 per cent above the March quarter’s certified 47,727 in original terms — part of that difference is seasonal, and the series is unadjusted, but it is consistent with the commencements turn documented in APN’s 31 August supply output. The supply pipeline is strengthening into the same window in which the demand side is being repriced. And the forward investment survey runs against the quarter’s flat actuals: expected private capital expenditure for 2026-27 was revised up 15.5 per cent between estimate rounds to $200.7 billion in the ABS’s late-August survey — an instance of precisely the investment-boom upside risk the Board’s August minutes named as strengthening the case for tightening.
The Divergence: Certified Economic Factors Readings
Source: APN Codex certified node metrics, reference periods as marked. Inflation (21220) and Employment & GDP (21230) reflect the June quarter; nodes 21210, 21510 and 21240 reflect the March quarter.
The Commonwealth Bank’s Revised Housing Outlook
Against this rate backdrop sits the Commonwealth Bank’s housing forecast, revised for the second time in three months on 1 September — the day before the accounts — and revised down hard. In June the bank’s economists had moved to expecting national dwelling prices to be flat over 2026, down from 3 per cent at Budget and 5 per cent in March; senior economist Trent Saunders’s new Economic Insights report now forecasts a national peak-to-trough decline of around 9 per cent this cycle, with Sydney at around 13 per cent, Melbourne at around 12 per cent and — the larger change — Brisbane, Perth and Adelaide at around 8 per cent, in cities where tight supply had previously been expected to hold prices up. The Reserve Bank’s August minutes independently corroborate both the fact and the attribution: members recorded national housing prices down around 1½ per cent from their March peak — still about 50 per cent above their pre-pandemic level and 5 per cent higher than a year earlier — and ascribed the easing to the combined effect of the cash rate increases, the Budget tax changes and weaker sentiment, with the relative importance of each difficult to discern. The bank’s stated trigger is pace and breadth: the adjustment over the past three months has been larger and faster than it anticipated, with national prices down 0.9 per cent in August — a fifth consecutive monthly decline — to 3.6 per cent below their March peak, Sydney 7.1 per cent below its February peak, Melbourne 6.5 per cent below its own, and Brisbane and Adelaide each recording three consecutive monthly falls with Perth recording four. Transaction-level measures move the same way: median time on market has risen from 15 to 35 days in Brisbane and from 9 to 22 days in Perth since the start of the year, and auction clearance rates are running below year-ago levels.
The forecast’s load-bearing assumption remains the rate path, and this time the bank has published the sensitivity. A higher interest rate outlook is one of the three reasons the bank gives for the downgrade — alongside momentum weakening faster than expected and the downturn spreading to tight-supply cities — and the 2027 recovery of around 2 per cent nationally relies on its forecast reductions in May and August next year. Saunders states it directly: were the cash rate instead to remain at 4.60 per cent throughout 2027, national dwelling prices would be broadly flat over the year. The conditionality the June forecast left implicit, the September forecast publishes as a number. Today’s repricing pushes on exactly that hinge. The futures-implied path — a peak near 4.8 per cent by mid-2027 — sits above even the bank’s no-cut scenario, for which no price sensitivity has been published, and borrowing capacity on that path compresses further from an indicator lending rate already at 8.77 per cent. On the Westpac path — no change this year, then cuts to 3.85 per cent by end-2027 — the recovery leg holds. The housing market is, in effect, the transmission channel for a disagreement the data has not yet resolved; against it sit the supports the bank itself lists — improving affordability, rising rental yields and a national rental vacancy rate at a historically low 1.8 per cent in August — with the adjustment expected to continue through the first half of 2027.
APN Analytical Synthesis
The June quarter accounts do not, on their own, force the Monetary Policy Board’s hand. Per-capita output is flat, productivity is stagnant, and the six-month annualised growth pulse is running well below trend. What the accounts do is remove the last plausible cover for patience while the trimmed mean holds at 3.6 per cent over a flat productivity denominator: on those two numbers together, unit labour cost growth is inconsistent with the 2–3 per cent band, and the 70 per cent September pricing is best read not as a verdict on growth but as a verdict on the Board’s tolerance for a further stretch of above-band underlying inflation. The August labour force survey is the one remaining release with the demonstrated capacity to reverse that pricing, and the decision will be taken the day before the August CPI is published — an informational asymmetry that has historically favoured the status quo, but which no longer maps cleanly to a hold when the Board has already debated a rise, held unanimously on explicitly conditional language, and named today’s accounts among the data it was waiting to see.
For housing, the significance is second-order but larger. CBA’s 1 September forecast — a national peak-to-trough decline of around 9 per cent, its third downgrade since March — already carries one further cash rate increase in its own baseline, and its 2027 recovery of around 2 per cent is, on the bank’s published sensitivity, fully consumed if the cash rate merely holds at 4.60 per cent through 2027. Market pricing implies a peak near 4.8 per cent by mid-2027, beyond even that no-cut scenario, and the housing market clears at whichever path eventuates: on the priced path, the correction’s depth and trough timing sit below the bank’s profile; on the Westpac path, the recovery leg holds. APN’s certified telemetry indicates which side currently carries the burden of proof — Inflation (21220) at +2.1049σ while no activity-side node reads above +0.6σ — and the strengthening approvals pipeline adds supply into the adjustment window either way. This synthesis speaks only to the structural conditions the cited data can independently support; it does not constitute a view on future dwelling prices, cash rate decisions or policy, and no such view is expressed or implied.
Disclaimer
The analysis and information contained in this publication are for general informational and strategic purposes only and do not constitute financial, investment, legal, or any other form of professional advice. Australian Property Network is not a licensed financial advisor. Property values and market conditions can go up or down. Before making any property or investment decisions, you must conduct your own thorough research and seek independent professional advice tailored to your specific circumstances.