Every state maps the places where bushfire or flood rules apply to new building, and publishes the map. The maps differ in what they trigger, how current they are and how often they change. Victoria has redrawn its bushfire prone area 26 times since it was first gazetted in 2011, most recently in June 2026. The statewide layer of flood planning areas in New South Wales carries an edition date of May 2019, and Queensland’s floodplain overlay is an interim 2013 product that is no longer updated. One figure among them says how much property sits inside a control: Victoria’s statement in 2017 that about 230,000 properties were in its Bushfire Management Overlay. A national count does not exist: NIL RETURN.
Node reading for Planning Regulations & Zoning Policy (21320): NIL RETURN. This article rests on the source data alone.
Two kinds of control
A hazard map in the planning system is not a forecast of fire or flood. It marks the land where particular rules apply, and those rules are of two kinds. A building control sets how a house must be built: in Victoria’s bushfire prone area, new buildings and additions must meet the bushfire requirements of the National Construction Code, at a construction standard of at least Bushfire Attack Level 12.5. A planning control decides whether and how land can be developed at all: an overlay in a planning scheme can require a permit, a site assessment or a referral to a fire or water authority before building starts.
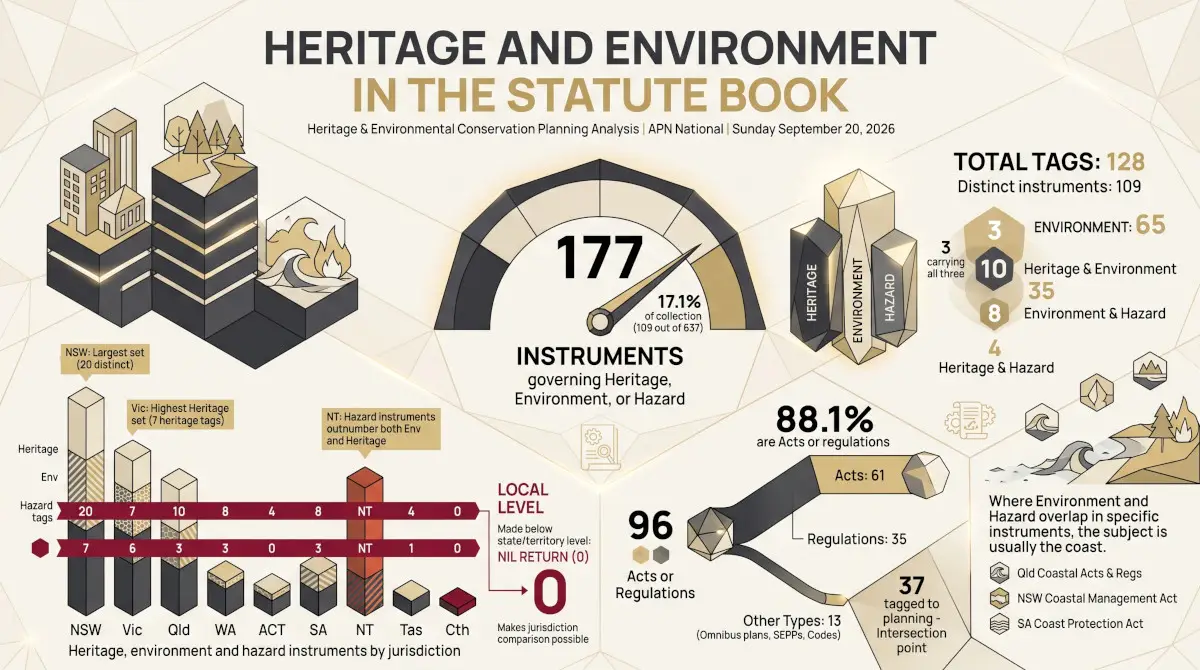
The same state can have both. Victoria maps a bushfire prone area for building and, separately, a Bushfire Management Overlay in its planning schemes. How much land any of them covers is not published by most states, and this piece does not measure it. The laws that set these controls are mapped in Heritage and Environment in the Statute Book, and the sustainability rules for new homes in Who Sets the Sustainability Rules for a New Home.
What each state maps
| Jurisdiction | Layer | What it triggers | Currency, as published | Earlier versions published |
|---|---|---|---|---|
| New South Wales | Bush Fire Prone Land | Planning for bush fire protection, and bushfire construction requirements | Catalogue entry last modified 29 October 2025 | No |
| New South Wales | Flood planning areas in local environmental plans (statewide layer) | Flood planning controls | Edition dated 22 May 2019; councils hold current flood mapping | No |
| Victoria | Designated bushfire prone area | Building construction standards | 27 gazettals, latest 16 June 2026 | Gazettal dates listed |
| Victoria | Planning scheme overlays, including the Bushfire Management Overlay | Planning scheme requirements | Overlay history layer updated weekly | Yes: an overlay history layer |
| Queensland | Bushfire prone area, statewide | Statewide mapping of the bushfire hazard area | Version 1.0, last updated 12 November 2020 | No |
| Queensland | Floodplain Assessment Overlay | Interim floodplain assessment for councils | 2013 project, no longer updated | No |
| South Australia | Planning and Design Code overlays | Code policies and referrals | Updated fortnightly | Yes: 108 versions, July 2020 to December 2025 |
| Western Australia | Bush fire prone areas | Bushfire planning, in two planning areas | Designated 13 December 2025 | Yes: earlier designations as separate data sets |
| Tasmania | Planning scheme code overlays | Code requirements | Current layer and historical layer | Yes: 1,577,094 dated historical overlay entries |
As stated on each publisher’s data page, read 29 September 2026. Sources: NSW Rural Fire Service and NSW Planning Portal; Victorian Department of Transport and Planning; Queensland Government open data; PlanSA via Data.SA; WA Department of Fire and Emergency Services; Tasmanian Government, theLIST. The ACT and the Northern Territory are not included.
Victoria: a map redrawn 26 times
Victoria’s bushfire prone area was first gazetted on 7 September 2011, and its boundaries have been changed by gazettal 26 times since, most recently on 16 June 2026. It was redrawn twice in every year from 2016 to 2023, and once in each of 2024 and 2025. Eleven metropolitan Melbourne municipalities, from Melbourne and Yarra to Port Phillip and Bayside, have no designated bushfire prone area at all.
Gazettals of Victoria’s bushfire prone area map, by year
Number of gazettals, the original designation of September 2011 included. 2026 to September. Source: Victorian Department of Transport and Planning, Designated Bushfire Prone Area data set, read 29 September 2026.
Victoria also publishes a history layer of its planning scheme overlays, updated weekly, from which the date each overlay boundary changed can be read. The one count of land under a hazard control among the sources here comes from the 2017 mapping update of the Bushfire Management Overlay. It added the overlay to about 108,000 properties and removed it from about 17,000, bringing the total to about 230,000, of which about 103,000 were public land.
New South Wales and Queensland: older and interim layers
New South Wales maps Bush Fire Prone Land by local government area, and the map is the trigger for planning for bush fire protection and for bushfire construction requirements; the statewide data set’s catalogue entry was last modified on 29 October 2025. Flood is different. The statewide layer of flood planning areas drawn from local environmental plans carries an edition date of 22 May 2019, and the publisher notes that councils have been responsible for flood mapping since 14 July 2021, so the statewide layer may not be the latest version. For current flood planning areas, each council’s own mapping is the source.
Queensland’s statewide bushfire prone area mapping is at version 1.0 and was last updated on 12 November 2020. Its Queensland Floodplain Assessment Overlay came from a 2013 project, was an interim assessment to help councils identify areas needing further work, is not intended to predict flooding for individual parcels, and is no longer updated.
South Australia, Western Australia and Tasmania: maps with a history
South Australia’s Planning and Design Code carries its overlays in one data set, updated fortnightly, and each published version is kept. From 2022 to 2025 it published between 19 and 24 versions a year.
Published versions of South Australia’s Planning and Design Code data sets, by year
Number of versions listed as historical releases, 31 July 2020 to 4 December 2025. Each version holds all Code zones and overlays, not only hazard overlays. Source: Data.SA, Planning and Design Code Datasets – Historical Versions, read 29 September 2026.
Western Australia’s map of bush fire prone areas was first released in December 2015, then annually on 1 June from 2016 to 2019, with two further updates in 2019. There was no review in 2020, an interim review was gazetted on 11 December 2021, and there was no review in 2022. The current designation, of 13 December 2025, divides the prone areas into two planning areas, and earlier designations remain available as data. Tasmania’s planning scheme maps 38 kinds of code overlay, among them bushfire-prone areas, flood-prone areas, and bands of coastal inundation, coastal erosion and landslip hazard, and it publishes a historical layer of 1,577,094 overlay entries with start and finish dates.
Why there is no national count
Counting the homes inside bushfire or flood controls needs each state’s control layer laid over its property boundaries or addresses, and a common definition of what counts as a control. The layers exist in most states, but they trigger different rules, some are building controls and some planning controls, and the New South Wales and Queensland flood layers are years old or interim. Among the sources here, Victoria’s 2017 overlay count is the only figure of its kind. A national count of land or homes under bushfire or flood controls cannot be built from what is published: NIL RETURN.
What this does not show
A control map shows where rules apply, not how likely a fire or flood is, and not how much a rule costs a builder. Land can be hazardous without being mapped, and a map can be drawn wide as a precaution. The platform’s measures of physical exposure, APN Substrate™ (Climate Resilience Rating) (24150) and its flood and bushfire components, read hazard data, not these controls, and the two are not combined here. Nothing here ranks the states. Heritage controls are covered in What Is Heritage-Listed? The Registers, State by State.
Findings are presented on the basis of data and evidence alone.