
Still Near the Peak: Construction Insolvencies and Mirvac’s Market Claims Tested
Hanan: Taxes and Levies, Not Planning, Now Hold Back New Housing (O-260926-OPID-MEDIUM)
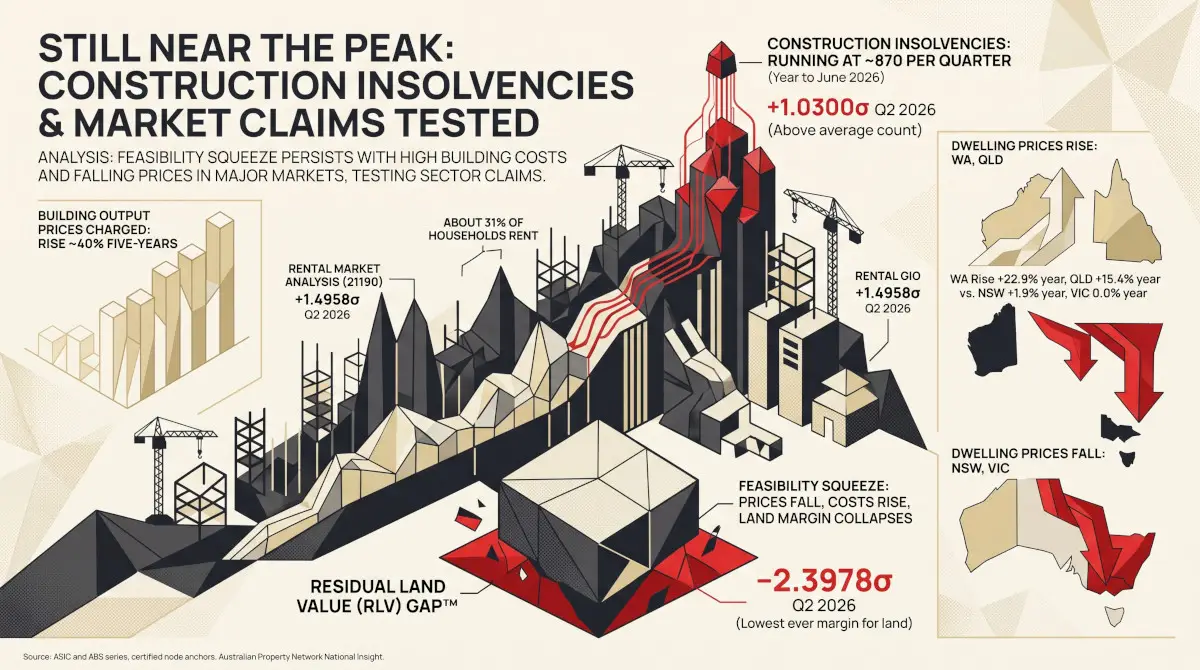
Construction Insolvency (21281) +1.0300σ Q2 2026 · position 84.2, ranked against 20 quarters
APN Residual Land Value (RLV) Gap™ (24410) −2.3978σ Q2 2026 · position 0.0, ranked against 60 quarters
Rental Market Analysis (21190) +1.4958σ Q2 2026 · position 93.3, indicative position, empirical ranking begins at 20 quarters (currently 12)
Scope and Purpose
In a September 2026 conversation with the Commonwealth Bank’s chief economist, Campbell Hanan, group chief executive of Mirvac, set out his reading of the housing and commercial property markets. His argument is carried in the companion Market Practitioners output, Hanan: Taxes and Levies, Not Planning, Now Hold Back New Housing. It rests on six checkable propositions about the wider market: that construction insolvencies are largely behind the sector; that building costs are about 40% higher than five years ago; that 31% of Australians rent; that rents are rising; that investor activity has slowed; and that prices are still rising in Western Australia and Queensland while New South Wales and Victoria are flatter. This output puts each against the ASIC and ABS series it rests on and against Australian Property Network’s (APN’s) certified readings. Figures that describe Mirvac’s own business are the speaker’s and are not tested. The short answer is that four of the six hold, one holds for rents generally but not at the rate he reports for build-to-rent, and one does not hold for the sector: construction insolvencies are still close to their peak.
Proposition One: Construction Insolvencies Are Largely Behind Us
The speaker puts post-COVID insolvency events at about 7,000. ASIC’s count of construction companies entering external administration for the first time was 6,474 over the three years to June 2024, which is consistent with that order of magnitude. The count did not fall after that. It was 3,596 in the year to June 2025, the highest of the five years shown, and 3,472 in the year to June 2026. The two years since June 2024 produced 7,068 construction insolvencies, more than the three years before them. The claim does not hold for the sector as a whole.
Construction Companies Entering External Administration, by Quarter, September 2021 to June 2026
Source: ASIC Insolvency Statistics, Series 1, companies entering external administration or having a controller appointed for the first time, Construction industry, Australia. Industry coding before the September quarter of 2021 is not comparable. Slate bars: the two years to June 2026.
Construction Insolvency (21281) reads +1.0300σ for the June quarter, 84.2 against the 20 comparable quarters since industry coding changed in 2021. The speaker’s narrower statement, that Mirvac has not seen an insolvency event in 15 months, is company data, and describes one large builder’s experience rather than the sector’s. APN’s When Builders Fail sets out what the insolvency record can and cannot show about who bears the losses.
Proposition Two: Building Costs Are About 40% Higher Than Five Years Ago
The claim holds for housing. The producer price index for the output of house construction, the price builders charge for new houses, rose 42.5% between the June quarters of 2021 and 2026. The index of the materials that go into house construction rose 34.2%. The speaker made the claim about office construction, for which APN holds no equivalent index, so the house construction figure is the nearest test. Most of the rise came in 2021–22 and 2022–23; in the year to June 2026, output prices rose 5.9% and input prices 3.8%. The latest output figure is above the 4 to 4.5% a year the speaker expects for costs ahead, which is a forecast and is not tested.
Producer Price Index, Output of House Construction, June Quarters 2021 to 2026
Source: ABS Producer Price Indexes (6427.0), output of the house construction industry, index. The price builders charge for new houses, including their margin.
The speaker’s expectation of higher cost growth in Queensland is a state claim. APN does not hold construction price indexes by state, and records the state split for construction costs as NIL RETURN.
Proposition Three: 31% of Australians Rent
At the 2021 Census, 2,894,910 of the 9,278,351 occupied private dwellings with a stated tenure were rented, or 31.2%. The figure holds as a share of households. It is a household measure rather than a count of people, and it dates from 2021; results from the August 2026 Census are not yet published.
The share differs widely by state. It was highest in the Northern Territory, at 47.3%, followed by Queensland (33.6%) and New South Wales (33.1%), and lowest in Western Australia (27.9%) and Tasmania (27.1%). Victoria was 29.0%, South Australia 28.1% and the Australian Capital Territory 31.2%.
Proposition Four: Rents Are Rising, and Build-to-Rent Rents at Double Inflation
Rents are rising. The rents component of the Consumer Price Index rose 3.6% in the year to June 2026, and Rental Market Analysis (21190), built from state bond data, reads +1.4958σ for the June quarter, position 93.3, the highest of its 12 full-coverage quarters. Across the rental market, however, rents are not growing at double inflation: prices overall rose 3.9% over the same year, slightly faster than rents. Over two years, rents rose 7.9% against 6.1% for prices overall. The monthly figures for August 2026, released on 30 September, show the same pattern: rents 3.6% higher over the year, the same annual rate as in May, and prices overall 4.0% higher (ABS Consumer Price Index). The speaker’s figure refers to the build-to-rent sector, as reported in Mirvac’s annual results; APN holds no build-to-rent rent series, and records it as NIL RETURN. His expectation that private rental supply will shrink as investors sell cannot be tested from the series APN holds, and is recorded as NIL RETURN.
Proposition Five: Investor Activity Has Slowed
Investors’ share of new housing loan commitments, by number, was 39.2% in the June quarter of 2026. That is down from 40.8% in December, and above the 38.1% of a year earlier. Investors’ share of new lending has eased since late 2025, by much less than the fall in Mirvac’s own sales to investors, from about 30% to 22%. A share can fall without a fall in the number of investor loans. Mirvac’s figure covers sales of its new dwellings, which is a narrower market than all lending.
Proposition Six: Western Australia and Queensland Still Rising, New South Wales and Victoria Flatter
The claim holds, and the state data show it clearly. In the June quarter of 2026, the mean dwelling price rose 2.2% in Western Australia and 1.4% in Queensland, and fell 2.4% in New South Wales and 2.1% in Victoria. Nationally, it fell 0.7%. Growth in Western Australia and Queensland has slowed, as the speaker says: in the March quarter, Western Australia rose 6.6% and Queensland 3.6%. South Australia, Tasmania and the Northern Territory also rose in the June quarter, and the Australian Capital Territory fell.
Change in Mean Dwelling Price, June Quarter 2026, by State and Territory
Source: ABS Total Value of Dwellings, mean price of residential dwellings, by state and territory. Percentage change on the March quarter of 2026. The mean price moves with the mix of dwellings as well as with prices.
Over the year to June 2026, the mean price rose 22.9% in Western Australia and 15.4% in Queensland, against 1.9% in New South Wales and 0.0% in Victoria.
Not Tested
The share of taxes, charges and levies in the cost of a new apartment, about 35% and up to 40 to 45% on the urban fringe, is the speaker’s figure; APN holds no series that measures it, and records it as NIL RETURN. The same applies to the average age of first home buyers. ASIC insolvency counts, consumer price rents and investor lending are also published by state or capital city; APN does not hold those state series, and records their state split as NIL RETURN. The forecasts — cost growth of 4 to 4.5% a year, supply drying up further than expected, and no large office supply response for ten years — are not tested.
APN Analytical Synthesis
Of the speaker’s six checkable propositions about the wider market, four hold: building costs are about 40% higher than five years ago, about 31% of households rent, investors’ share of new lending has eased, and prices are still rising in Western Australia and Queensland while falling in New South Wales and Victoria. A fifth holds for rents generally, which rose 3.6% over the year, but not at the double-inflation rate he reports for build-to-rent. The sixth does not hold for the sector: construction insolvencies ran at about 870 a quarter through the year to June 2026. APN Residual Land Value (RLV) Gap™ (24410) reads −2.3978σ for the June quarter, the lowest of its 60 quarters. The data are consistent with the feasibility squeeze at the centre of the speaker’s argument: prices falling in the largest markets, construction costs higher, and the margin left for land at its lowest in the series.
What the data cannot do is apportion that squeeze between development taxes and levies, materials and labour, and prices, which is where the speaker’s policy case rests. The September quarter figures for insolvencies, construction prices and dwelling values will show whether the squeeze is easing. This synthesis speaks only to the structural conditions the cited data can independently support; it does not constitute a view on future prices, construction costs, rents or policy, and no such view is expressed or implied.
Disclaimer
The analysis and information contained in this publication are for general informational and strategic purposes only and do not constitute financial, investment, legal, or any other form of professional advice. Australian Property Network is not a licensed financial advisor. Property values and market conditions can go up or down. Before making any property or investment decisions, you must conduct your own thorough research and seek independent professional advice tailored to your specific circumstances.