
The Reversal: Australia’s Housing Stock Value Turns Negative for the First Time Since 2022
The Australian Bureau of Statistics measures the value of the nation’s entire housing stock — every house, townhouse and apartment, owned by households and by every other sector — each quarter, in a release called the Total Value of Dwellings (TVD). It is not a price index in the way most readers think of one: it does not track how much the same house resells for over time. It is a stock estimate, built from two figures the ABS publishes side by side — the mean price of a dwelling, and the number of dwellings believed to exist — multiplied together.
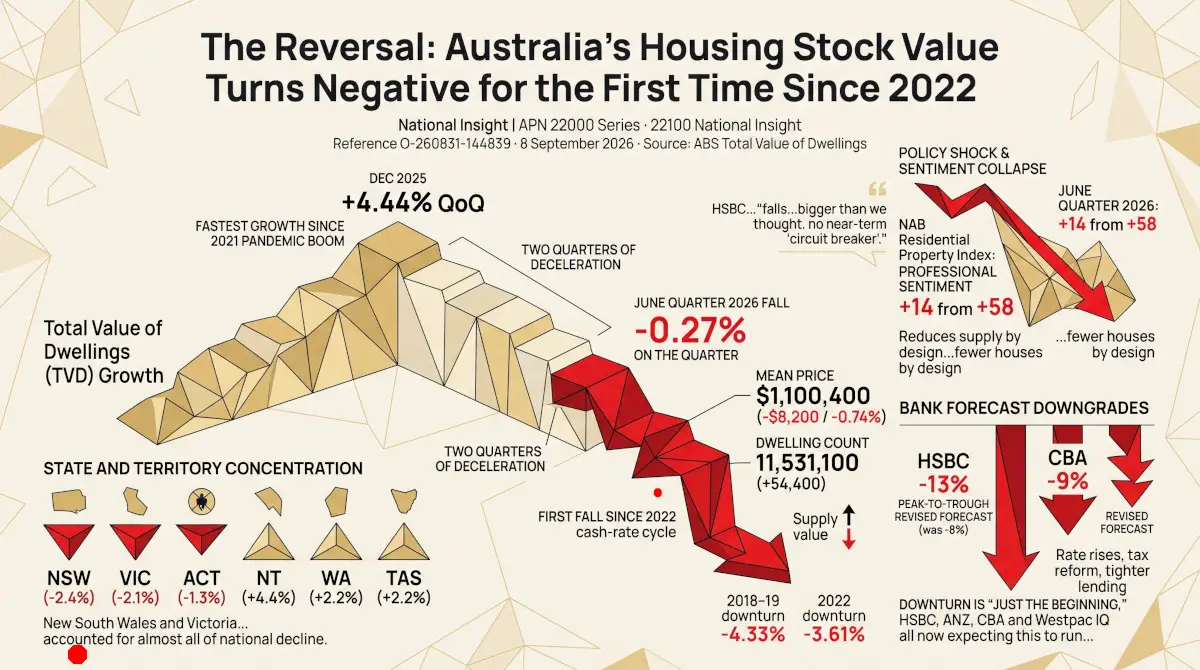
For two straight quarters, that combination has been decelerating from its fastest growth since the 2021 pandemic property boom. In the June quarter of 2026, it turned negative — the first fall since the September 2022 quarter, when the Reserve Bank’s cash-rate tightening cycle drove a downturn of its own.
Two quarters of deceleration, then a reversal
The chart below shows quarter-on-quarter growth in the total value of the dwelling stock over the last seven quarters. The pattern is not noise: growth accelerated through most of 2025, peaked at +4.44% in the December quarter — the fastest quarterly growth in the period shown — and then decelerated for two consecutive quarters before turning negative in June 2026.
A single quarterly fall does not make a trend on its own. But the shape either side of it does: this is not a level series wobbling around a flat average, it is a growth rate that ran hotter than at any point since the 2021 pandemic property boom, peaked, and has now decelerated for two consecutive quarters in a row — ending in the first fall since the 2022 downturn.
How this compares to the last two downturns
This series has been through two real downturns before, both driven by well-documented macro episodes: the 2018–19 lending-standards tightening (following the banking royal commission and APRA’s macroprudential measures) and the 2022 Reserve Bank cash-rate hiking cycle. The chart below shows the full fifteen-year history, with both downturns visible as genuine multi-quarter dips.
Zoomed out to the full history, ten of the last fifty-nine quarters have shown a fall — not only the six making up the two named downturns below. Three were isolated single-quarter dips that never developed into a sustained decline: December 2011 and September 2012 (both under −0.5%, no identified cause), and June 2020, the COVID-19 lockdown quarter (−0.37%), which recovered the very next quarter. Unlike 2018–19 and 2022, none of the three was followed by a second consecutive fall.
| Episode | Peak | Trough | Decline | Duration |
|---|---|---|---|---|
| 2018–19 downturn | Mar 2018 ($6,957.2bn) | Mar 2019 ($6,656.0bn) | −4.33% | 4 quarters |
| 2022 downturn | Mar 2022 ($10,094.1bn) | Sep 2022 ($9,730.0bn) | −3.61% | 2 quarters |
| 2026 (current) | Mar 2026 ($12,723.0bn) | Jun 2026 ($12,688.9bn)So far | −0.27% | 1 quarter, ongoing |
On both prior occasions, the fall ran for two to four consecutive quarters before growth resumed. Whether the current episode follows that pattern or proves to be a single-quarter pause is not yet knowable from one data point — but by peak-to-trough size, June 2026’s fall is currently the mildest of the three by a wide margin.
Not a broad-based fall
The national number also understates how concentrated the June quarter’s fall actually was. APN’s own state and territory breakdown of the same release shows the mean price of a dwelling fell in exactly three jurisdictions and rose everywhere else.
New South Wales (−2.4%) and Victoria (−2.1%) — Australia’s two largest housing markets — account for almost all of the national decline, with the ACT (−1.3%) adding a smaller third leg. Every other state and territory rose, led by the Northern Territory (+4.4%), Western Australia (+2.2%) and Tasmania (+2.2%). Sydney and Melbourne had already been softening for months before this release: auction clearance rates and price growth in both cities began diverging from the rest of the country from around mid-2025, well ahead of the national figures turning down. That narrowness hasn’t held in the weeks since this release — see below.
Supply keeps growing while value slows
The more striking part of the release sits in the second published figure: the number of dwellings. It rose by 54,400 in the June quarter — the largest single-quarter addition to the national dwelling count in at least three years, against a recent run rate of 32,000–46,000 a quarter.
Put the two figures together and the picture is a market where the stock of homes is expanding at its fastest pace in years, while the aggregate value of that stock — and the average price per dwelling within it — has stopped rising and, this quarter, gone backwards. Whether that’s supply catching up to steady demand, or supply landing straight into demand that’s being actively suppressed, is the question the rest of this piece works through below.
Where the new supply is coming from
ABS Building Approvals small-area data for July 2026, loaded the same day as this release, shows where that supply growth is concentrated. The ten local government areas approving the most new dwellings nationally are dominated by two patterns: capital-city LGAs with large apartment-tower approvals, and the outer-metropolitan growth corridors that have driven Australian new-house construction for years.
Brisbane and Melbourne lead on volume — both capital-city LGAs where a handful of large apartment developments can swing the monthly count sharply. The rest of the list is almost entirely outer-metropolitan growth corridors: Wyndham, Melton and Hume around Melbourne; Logan and Moreton Bay around Brisbane; Wanneroo around Perth. This is the supply side of the dwelling-count story above — new stock entering the market fastest exactly where it has for most of the last decade.
TVD is a national stock aggregate, not a repeat-sales price index. A mean-price fall of 0.74% in one quarter is a real, measured move in this series — it is not evidence of a broad market correction, and it says nothing about any individual suburb, property type or price bracket. Read it for what the history above shows it to be: a real deceleration off the fastest growth run since the 2021 pandemic property boom, but by historical standards, a mild one so far.
The banks have already moved
Hours after this release, HSBC published a sharp downgrade to its own housing outlook — from an 8% to a 13% peak-to-trough decline in national prices, which chief economist Paul Bloxham said would make this the largest housing correction in thirty years if it plays out. "As we had expected, the housing market has weakened quickly following the significant tax changes," Bloxham said. "However, the falls that have arrived have been bigger than we had thought. The current housing price decline is therefore occurring with no near-term ‘circuit breaker’."
HSBC’s own city-level forecast puts Sydney at the sharp end (−16%), followed by Melbourne (−14%) and Canberra (−12%) — the same three jurisdictions this release’s own state breakdown above already shows leading the fall. Brisbane and Perth are forecast at −10%, Adelaide and Hobart at −7%.
| Bank | Prior 2026 outlook | Revised outlook | Cited drivers |
|---|---|---|---|
| HSBC | −8% peak-to-trough | −13% peak-to-trough | Rate rises, May Budget tax reform, investor pullback |
| ANZ | −2.1% | −4.3% | Rate hikes, tax settings, consumer confidence |
| CBA | Flat (Jun 2026) | −9% peak-to-trough | Rate rises, tax reform, tighter lending |
| Westpac IQ | — | Flat | — |
Bank forecasts are peak-to-trough or full-calendar-year projections, not the single-quarter measure this release covers — they aren’t directly comparable to APN’s own −0.27% quarterly figure, but they’re the clearest signal yet of where the banks think this is heading. ANZ separately forecasts Sydney at −8.4% and Melbourne at −7.7% for calendar 2026.
CBA’s own numbers, published just a week before this release, are the starkest yet. Senior economist Trent Saunders said "the adjustment over the past three months has been larger and faster than we anticipated," as CBA lifted its national forecast to a 9% peak-to-trough decline (Sydney −13%, Melbourne −12%, Brisbane, Perth and Adelaide −8% each). Nationally, prices had already fallen for five straight months to August, down 3.6% from their March peak — and critically, CBA’s own data shows the fall has already spread well past the three jurisdictions in this release’s own June-quarter breakdown above, reaching Brisbane, Perth and Adelaide as well.
The drivers HSBC and ANZ name — the RBA’s rate rises to 4.35% and the Treasury Laws Amendment (Tax Reform No. 1) Bill 2026, both explored in more depth below — change how the single −0.27% quarter above should be read. This isn’t background context to a mild, self-correcting wobble; multiple banks are now calling it the proximate cause of a downturn they expect to run for years, not quarters. CBA’s own timeline has the adjustment continuing through the first half of 2027 before stabilising; ANZ doesn’t pencil in a fuller rebound until 2028.
APN Analysis
Two consecutive quarters of deceleration ending in a fall this small and this narrow — three jurisdictions accounted for the entire national decline, the rest of the country kept growing — against a backdrop of two much larger, broader downturns, looked, on the release alone, like normalisation rather than a demand shock: the growth rate that peaked at +4.44% in December 2025 was the fastest since the 2021 pandemic property boom, and outlier growth rates tend to mean-revert. That reading hasn’t survived the days since. As set out above, major banks now expect this quarter to be the opening move of a much larger decline, not a one-off correction.
As noted above, a record 54,400 net new dwellings arrived the same quarter the market cooled. A supply wave landing into steady demand looks the same, on this one number alone, as a supply wave landing into demand that’s being actively suppressed — the banks above name which one this is.
This quarter didn’t happen in a vacuum. The same June quarter saw the Treasury Laws Amendment (Tax Reform No. 1) Bill 2026 pass into law, restricting negative gearing to new-build purchases and replacing the CGT discount with cost-base indexation — a genuine new demand-side lever, layered on top of the APRA lending buffer already in force since 2021 (certified at APN Codex’s Banking & Lending Regulation (21350)APN’s index of how much APRA’s mortgage-serviceability rules constrain borrowing capacity.: −1.41σ as at December 2025, the most recent quarter available). APN’s own certified credit and sentiment indices are one quarter behind this release — their latest certified reading is March 2026 — so they can’t yet confirm the demand-side channel from platform data alone. But that channel doesn’t need APN’s own indices to establish it — the banks above already have.
What to watch next
The nearest test comes well before the next TVD release. Bond markets have already moved in the weeks since this quarter closed: the 10-year yield hit 5.17% in September, its highest since 2011, as stronger-than-expected inflation (trimmed mean still at 3.6%, above the RBA’s target) built the case for further tightening. Markets now price a 66% chance the RBA raises the cash rate to 4.60% at its 29 September meeting — NAB, Deutsche Bank, UBS and Morgan Stanley are all forecasting it — with roughly even odds of a further move to 4.85% after that. The rate pressure this piece has already identified as a driver of the June quarter’s fall isn’t finished building.
The next release, due in December 2026 and covering the September quarter, will show whether the banks’ downgrades are already showing up in the certified data. With HSBC, ANZ, CBA and Westpac IQ all now expecting this to run well past one quarter, a second consecutive fall would be the expected outcome, not a surprise — the open question is closer to how far this goes than whether it continues.
June 2026’s −0.27% print is itself provisional: under ABS methodology, an estimate isn’t considered final until two more quarterly releases have passed. As the companion piece sets out, that’s exactly what just happened to March 2026 and December 2025 in this release — this would not be the first time a headline print revised away. Separately, July 2026 approvals data shows no sign of the construction pipeline slowing; if dwelling-count growth continues at its current pace without a matching recovery in mean price, that would extend the current deceleration rather than reverse it.
Separately, two of APN’s own sentiment and credit-appetite indices — Sentiment & Behavioural Conditions (24750)APN’s index of lending patterns, household spending and property-industry sentiment. and Household Finance & Consumer Sentiment (21240)APN’s index of household financial position and consumer sentiment. — are also one quarter behind this release, with early data for the June quarter already hinting at a pullback among investor-facing indicators. Once the matching lending data lands and those indices recertify, that will be the clearest platform-native confirmation of what the banks above are already pricing in.
The certified record
| Quarter | Total Value | QoQ | Mean Price | Dwellings |
|---|---|---|---|---|
| Sep 2024 | $11,053.4bn | — | $983,300 | 11,241.1k |
| Dec 2024 | $11,319.5bn | +2.41% | $1,002,900 | 11,286.7k |
| Mar 2025 | $11,409.4bn | +0.79% | $1,007,800 | 11,320.7k |
| Jun 2025 | $11,696.7bn | +2.52% | $1,029,900 | 11,357.5k |
| Sep 2025 | $11,977.9bn | +2.40% | $1,050,900 | 11,398.3k |
| Dec 2025Revised | $12,509.3bn | +4.44% | $1,093,200 | 11,442.5k |
| Mar 2026Revised | $12,723.0bn | +1.71% | $1,108,600 | 11,476.7k |
| Jun 2026 | $12,688.9bn | −0.27% | $1,100,400 | 11,531.1k |
Two quarters in this table were revised in the same release that reported June 2026 — see the companion piece below for what changed and why.