
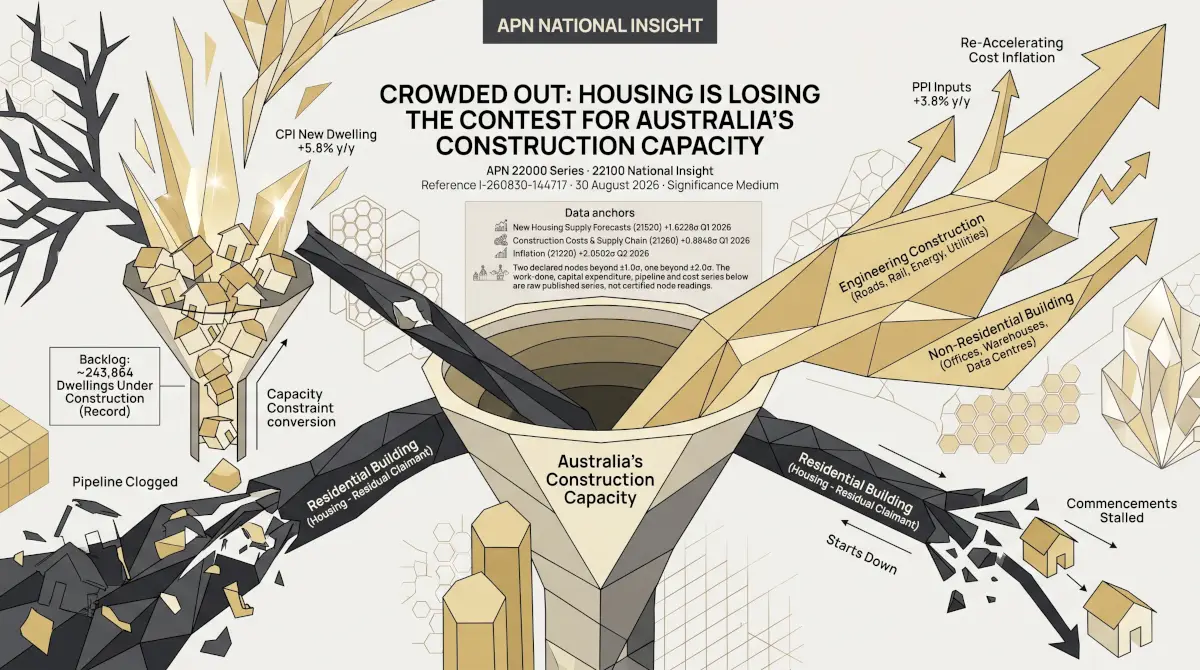

Crowded Out: Housing Is Losing the Contest for Australia’s Construction Capacity
New Housing Supply Forecasts (21520) +1.6228σ Q1 2026
Construction Costs & Supply Chain (21260) +1.3708σ Q1 2026
Inflation (21220) +2.1049σ Q2 2026
Scope and Purpose
Australian Property Network’s (APN’s) Construction Paradox output of 26 August documented a gap: dwelling approvals accelerating while commencements stall. It stopped short of naming a mechanism. This output tests one. Australia’s construction industry is one pool of labour, materials and finance serving three customers — housing, commercial and industrial building, and engineering infrastructure — and the question is whether housing has been losing that contest. Five series are read together: construction work done by type, business capital expenditure by asset, the residential pipeline (starts, dwellings under construction, and work yet to be done), construction input costs, and new-dwelling prices. The evidence says housing has been the residual claimant on construction capacity for five years, and the bill is now arriving as cost inflation.
Who Has Been Building
Indexed to the June quarter of 2021, the three types of construction have diverged sharply. Engineering construction — roads, rail, energy, utilities — is up 30% in real terms. Non-residential building — offices, warehouses, hospitals, schools, data centres — is up 22%. Residential building is up 11%, and almost all of that has come in the past year. For the four years to mid-2024, residential work done went nowhere: $25.0 billion a quarter in June 2021, $24.3 billion in June 2024, a real decline of 3% across a period in which the other two categories grew by a fifth and a quarter respectively.
Construction Work Done by Type, Jun 2021 – Jun 2026
Source: ABS 8755.0 Construction Work Done, Australia, Preliminary, June 2026 quarter, Tables 1 and 3. Non-residential building derived as total building less residential. Chain volume measures, seasonally adjusted, indexed to June quarter 2021 = 100.
The recovery in residential work since mid-2025 is real — +9.1% over the year to June 2026 — and it is the reason node 21520 (New Housing Supply Forecasts) reads +1.6228σ for the March quarter. But it has not closed the gap. Non-residential building grew 11.5% over the same year, engineering was volatile but still 30% above its 2021 base, and residential remains the slowest-growing use of construction capacity over any horizon longer than twelve months.
The Long View: Forty Years of the Same Contest
The five-year window understates how long this has been going on. Measured as a share of all construction work done in Australia, housing accounted for 37% in 1986 and between 40% and 50% for most of the 1990s and 2000s. It then fell without interruption through the mining investment boom, bottoming at 23.8% in the June quarter of 2012 when engineering work was running at two and a half times its 2005 level. The recovery since has taken housing back only to 34% — below any reading recorded before the boom began. Over the full forty years engineering construction has grown 4.6-fold in real terms, residential building 3.0-fold, and non-residential building 2.3-fold: housing has been the middle claimant on capacity for a generation, and the residual one since 2008.
Housing’s Share of Australian Construction, Sep 1986 – Jun 2026
Source: ABS 8755.0 Construction Work Done, Australia, Preliminary, June 2026 quarter, Tables 1 and 3. Residential building work done divided by total construction work done (building plus engineering), chain volume measures, seasonally adjusted. The June 2000 spike reflects work pulled forward ahead of the GST.
The pipeline data reaches back almost as far and tells a matching story from inside the housing sector. In the mid-1980s the number of dwellings under construction was equivalent to about two quarters of starts — a home begun in March was, on average, finished by spring. The ratio was still 2.0 in 2000. It reached 3.0 by 2004, 3.8 by 2016, peaked above 5.5 in 2023 and stands at 4.9 today. The time a dwelling spends under construction has more than doubled in a quarter of a century, and every step up in that ratio has coincided with a period of competing demand for construction capacity: the 2000s commercial boom, the 2010s apartment boom, and the post-2021 infrastructure and business-building surge. That is the structural backdrop against which today’s record backlog and flat starts should be read.
How Long a Dwelling Stays in the Pipeline, Jun 1985 – Mar 2026
Source: ABS 8752.0 Building Activity, Australia, March 2026 quarter, Tables 33 and 76. Dwelling units under construction divided by the trailing four-quarter average of dwelling commencements, total sectors, original. A ratio of 2.0 means the stock under construction equals two quarters of starts.
Where the Money Is Going
The demand side of that contest is visible in business investment. Private capital expenditure on buildings and structures reached a record $28.1 billion in the June quarter of 2026, up 3.6% on the quarter and 7.2% on the year, and 61% above its level five years ago in nominal terms. Equipment, plant and machinery capex, by contrast, fell 8.9% in the quarter, giving back most of a March-quarter spike. Businesses are rotating investment out of machinery and into buildings — and every dollar of that is a dollar bidding for the same trades, the same concrete and the same site managers that a housing project needs.
Business Capital Expenditure by Asset Type, Jun 2021 – Jun 2026
Source: ABS 5625.0 Private New Capital Expenditure and Expected Expenditure, Australia, June 2026 quarter, actual expenditure, all industries. Current prices, seasonally adjusted. Buildings and structures includes non-residential and engineering assets; it is not directly comparable to the chain-volume work-done series above and the two should not be netted.
What the Residential Pipeline Looks Like From Inside
If housing were simply short of demand, its pipeline would be thin. It is the opposite. The value of residential building work yet to be done has doubled in five years, from $40.4 billion in March 2021 to $80.3 billion in March 2026. Dwellings under construction, at 243,864, are within 0.1% of the record set at the 2022 HomeBuilder peak. And yet commencements — the number of new dwellings actually started — are 8% below where they were in March 2021. The pipeline is not thin; it is clogged. More projects are in progress, each carrying more outstanding work, and fewer new ones are getting under way.
The Residential Pipeline: Backlog Up, Starts Down, Mar 2021 – Mar 2026
Source: ABS 8752.0 Building Activity, Australia, March 2026 quarter. Value of residential building work yet to be done (Table 50, current prices), dwelling units under construction, and dwelling commencements; all original, indexed to March quarter 2021 = 100.
The ratio makes the point precisely. Work yet to be done per dwelling under construction has risen from about $206,000 to about $329,000, a 60% increase. Construction input prices rose 35% over the same period, so roughly three-fifths of the increase is cost inflation. The remaining two-fifths is not — unfinished work per dwelling is up about 19% in real terms — and each dwelling under construction now represents materially more unfinished work than it did five years ago. That is what a sector building slower, larger, or more complex projects — or all three — looks like from the outside. It is also exactly what an industry rationing capacity across too many customers produces.
The Bill Is Arriving
Construction input costs had been quiescent since the 2022–23 spike: annual growth in the producer price index for house-construction inputs fell from 17% to about 1% by mid-2024 and stayed there for a year. It is now re-accelerating. The June 2026 quarter alone added 2.1%, the largest quarterly rise since the December quarter of 2022, taking annual growth to 3.8%. The CPI measure of what households pay for a new dwelling has moved faster still — 5.8% over the year to June, from a low of 0.4% twelve months earlier — and was among the fastest-moving components within Housing in the July monthly indicator. Construction Costs & Supply Chain (21260) reads +1.3708σ for the March quarter (recertified on a repaired insolvency input, a measurement change rather than a change in conditions), before the June-quarter rise; the June data will push it higher.
Construction Cost Inflation Is Turning Back Up, Mar 2022 – Jun 2026
Source: ABS 6427.0 Producer Price Indexes, Table 18, input to the house construction industry, weighted average of six capital cities, June 2026 quarter; ABS 6401.0 Consumer Price Index, new dwelling purchase by owner-occupiers, quarter-end month, June 2026. Year-on-year change.
APN Analytical Synthesis
The balance of evidence is structurally consistent with a construction sector in which housing has been the residual claimant on capacity since the mining boom, and the losing one in every capacity contest for forty years. Housing’s share of all construction work done has not regained its pre-2008 range; the time a dwelling spends under construction has more than doubled since 2000; engineering and non-residential building grew first and fastest in the current cycle; business investment in structures is at a record and still rising while investment in equipment is falling; the residential pipeline has doubled in outstanding value and returned to record dwellings-under-construction without a corresponding rise in starts; and input-cost inflation, dormant for two years, turned back up in the June quarter at the fastest rate since 2022. Read together, these are the marks of a single capacity constraint being shared out among competing uses, with housing — the customer with the thinnest margins and the most price-sensitive end buyer — getting what is left.
Two readings are consistent with the data. One is benign: the 2025–26 recovery in residential work done is the leading edge of capacity flowing back toward housing as the infrastructure cycle peaks, and the cost re-acceleration is a transitional effect of that hand-over. The other is not: the record capex on buildings and structures says business demand for construction is still rising, so housing is recovering into a market that is tightening rather than loosening, and the June-quarter cost jump is the first sign of what that costs. The data cannot yet separate the two; what it rules out is the idea that housing supply is constrained by approvals or demand. The approvals are there. The pipeline is full. What is scarce is the capacity to convert one into the other. This synthesis speaks only to the structural conditions the cited data can independently support; it does not constitute a view on future construction volumes, prices or policy, and no such view is expressed or implied. The 7 October 2026 Building Activity release, carrying June-quarter commencements and work yet to be done, is the next data point that will test this reading.
Disclaimer
The analysis and information contained in this publication are for general informational and strategic purposes only and do not constitute financial, investment, legal, or any other form of professional advice. Australian Property Network is not a licensed financial advisor. Property values and market conditions can go up or down. Before making any property or investment decisions, you must conduct your own thorough research and seek independent professional advice tailored to your specific circumstances.

