
Miserable, and Spending Like It: The Confidence–Spending Gap Has Changed Sides
Inflation (21220) +2.1049σ Q2 2026
Household Finance & Consumer Sentiment (21240) +0.0144σ Q1 2026
Scope and Purpose
Two data points landed within a day of each other in late August 2026 and appear to contradict one another. Household spending for July 2026 rose 7.0% on a year earlier — the strongest annual growth in the fourteen months shown below. Consumer confidence for June 2026 sat at −19, the second-weakest reading in the same window and roughly twelve points below where it was a year ago. This output sets out what the two series actually show when read together, and uses the discretionary/non-discretionary split inside the spending data to test the usual explanation for that gap.
What the Headline Series Show
The ABS Monthly Household Spending Indicator (seasonally adjusted, current prices) reached $82.3 billion in July 2026, up 7.0% year on year and 1.1% on the month. Deflated by the July monthly CPI indicator (+3.5% annual), that is real growth of roughly 3.4% — well clear of population growth. Inflation (21220), one of two declared anchors for this output, reads +2.1049σ at Q2 2026: prices are still rising faster than the node’s long-run baseline, so the nominal figure overstates the real one, but not by enough to remove it.
Set against that, the OECD’s composite consumer confidence measure for Australia fell from −7 in June 2025 to −19 in June 2026, with the whole of the deterioration concentrated in April–June 2026 (−20, −17, −19). NAB’s survey of property professionals fell sharply over the same quarter, from +58 to +14. Households are reporting the weakest sentiment in years while their spending accelerates.
Household Spending Growth vs Consumer Confidence, Jun 2025 – Jul 2026
Source: ABS 5682.0 Monthly Household Spending Indicator, Table 1, total household spending, seasonally adjusted, current prices, year-on-year change (July 2026 release). OECD Consumer Opinion Surveys, composite consumer confidence for Australia, seasonally adjusted net balance, via FRED. Confidence for July 2026 not yet published.
The Usual Explanation — and Why It No Longer Holds
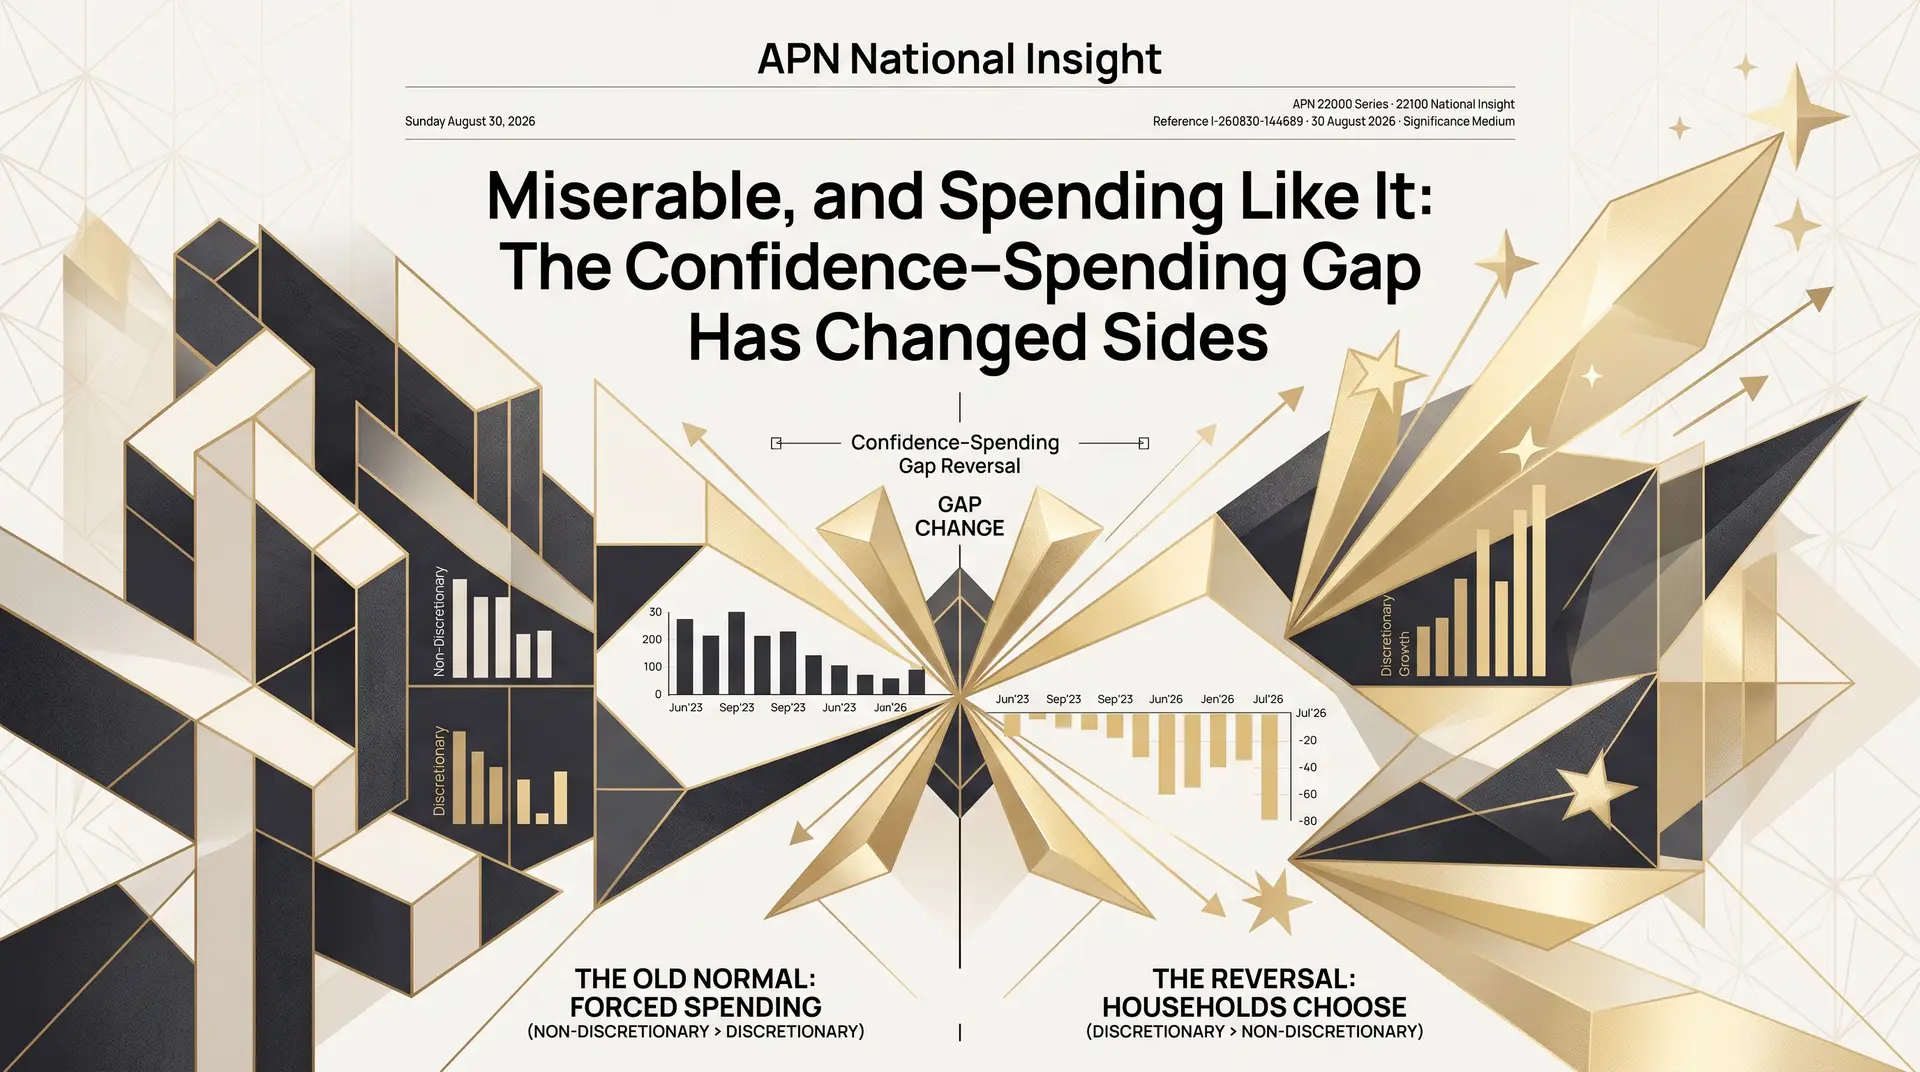
The standard reconciliation of that gap is that the spending growth is forced: rent, insurance, energy and food are rising, so households spend more while feeling worse. For most of the past three years the data supported that reading. Australian Property Network (APN) tracks the gap between non-discretionary and discretionary spending growth as a spread in basis points — positive when the bills are growing faster than the choices — and it was positive in every quarter from September 2023 to March 2026, peaking at +464 basis points in the March quarter this year, when non-discretionary spending was growing at 9.7% against 5.1% for discretionary.
In the June quarter it turned negative, for the first time in three years. Discretionary spending grew 7.3% year on year against 6.1% for non-discretionary, a spread of −122 basis points. July widened it further: discretionary +8.4%, non-discretionary +5.7%, a gap of −277 basis points. The acceleration in total spending is coming from the part of the budget households choose, not the part they cannot avoid.
Non-Discretionary Minus Discretionary Spending Growth, Quarterly, Jun 2023 – Jun 2026
Source: derived from ABS 5682.0 Monthly Household Spending Indicator, Table 1, discretionary and non-discretionary household spending, original, current prices; year-on-year growth in the final month of each quarter, difference expressed in basis points. Gold bars: the five quarters cited in this piece. Red bar: June 2026, the first negative reading since June 2023.
The reversal is not a one-month artefact of the discretionary series alone: non-discretionary growth has also stepped down, from 9.7% in March to 5.7% in July, consistent with the easing in headline inflation over the same period. But the discretionary side moved more, and in the other direction. Households did not merely stop being squeezed; they started spending.
APN Analytical Synthesis
The balance of evidence is structurally consistent with a household sector whose stated confidence and actual behaviour have decoupled. Twelve months ago the two agreed: confidence was mildly negative and spending growth was being driven by unavoidable costs, exactly the pattern a squeezed household produces. In the June quarter of 2026 confidence fell to its weakest level in the window while discretionary spending growth overtook non-discretionary for the first time since 2023 — the pattern of a household that says it feels worse and acts as though it feels better.
Two readings are consistent with the data. One is that confidence surveys are responding to a specific shock — the Federal Budget’s investor-housing tax changes, which NAB explicitly cites for its own fall — that has not reached most households’ wallets. The other is more uncomfortable: wages are not funding this. The Wage Price Index grew 3.2% in the year to June 2026 against a 3.5% CPI, so real wages were flat to slightly negative while real spending grew around 3.4% — which means the discretionary acceleration is being financed from somewhere the spending indicator cannot see: savings drawdown, asset wealth, credit, or more hours worked. The data cannot yet separate those readings. What it can say is that the “forced spending” explanation for the confidence gap, which was correct for three years, stopped being correct in the June quarter of 2026. This synthesis speaks only to the structural conditions the cited data can independently support; it does not constitute a view on future consumption, prices or rates, and no such view is expressed or implied. The August spending indicator, due late September, and the July confidence print are the next data points that will test whether the reversal holds.
Disclaimer
The analysis and information contained in this publication are for general informational and strategic purposes only and do not constitute financial, investment, legal, or any other form of professional advice. Australian Property Network is not a licensed financial advisor. Property values and market conditions can go up or down. Before making any property or investment decisions, you must conduct your own thorough research and seek independent professional advice tailored to your specific circumstances.