
The CBD Signature: What Seven Capital Cities Have in Common
This piece draws on APN’s first release from the 24100 node series — five independent data pillars representing a substantial body of new research across Census, crime, education, amenity and hazard data. At this stage the series should be read as foundational rather than final: the overall composite weighting is still interim, pending formal ratification, and individual sub-components carry their own disclosed limitations. It is best suited to long-horizon location screening, comparative research across suburbs and capitals, and framing structural conversations about what a place durably is — rather than as a live signal for time-sensitive decisions. It should not be read as investment advice, and it is not designed to answer questions about market timing.
The Sentinel (24120) figures in this piece are drawn from the 29 July 2026 data vintage stated in the Methodology Note below. On 9 August 2026, APN harmonised how the Sentinel crime pillar is computed for NSW and SA, bringing them onto the same small-area cascade convention already used by the other five jurisdictions. This changed Sentinel readings nationally, including for Sydney (CBD 15.6 → 18.0) and Adelaide (CBD 13.5 → 13.4); Perth’s reading also moved slightly (21.1 → 20.4) as a downstream effect of the national percentile re-basing this triggered. The pattern and conclusions described in this piece are unaffected, but the specific figures quoted are a historical snapshot, not the current live reading.
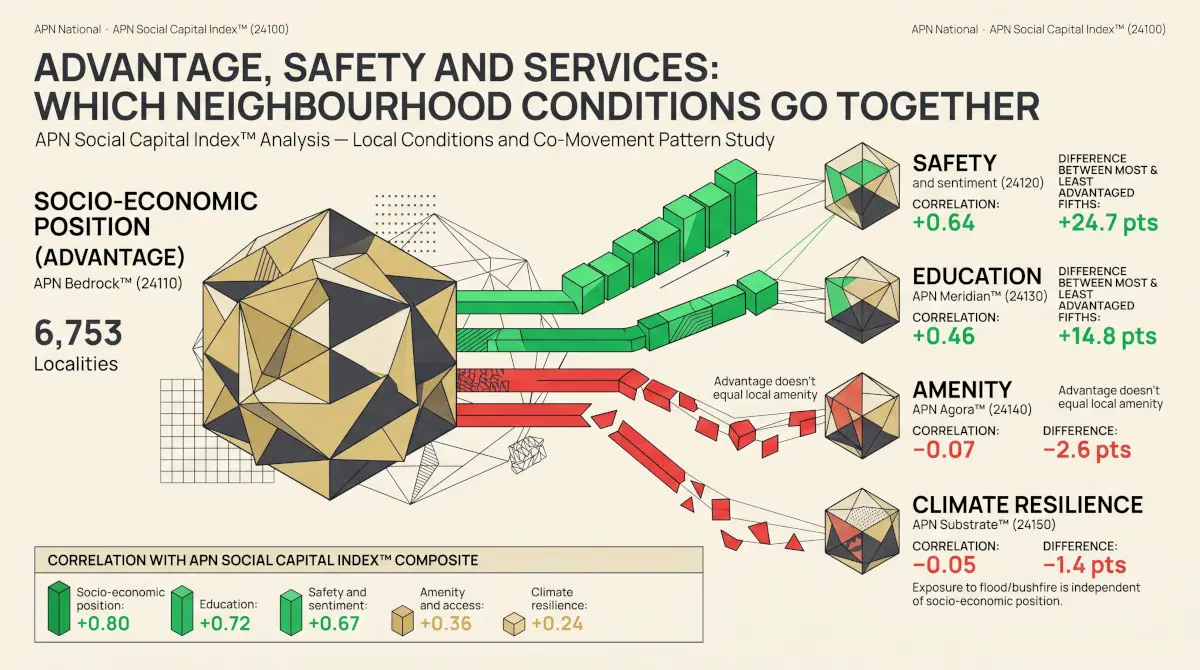
Correction, October 2026. The APN Bedrock™ (24110) figures in this piece are restated on Bedrock methodology v1.1, which joins every Census figure to its locality by the ABS suburb code, reads unemployment for all persons and reads the SEIFA advantage and disadvantage index (IRSAD). The other four pillars remain at the 29 July 2026 vintage, and each APN Social Capital Index™ (24100) figure is the mean of the five pillar figures shown.
Restatement, 11 October 2026. APN Sentinel™ (Safety & Sentiment Index) (24120) was rebuilt on 11 October 2026. Recorded crime rates now use the ABS estimated resident population at 30 June 2025 and count the same offences in every state and territory, and the Demographic Tension Index (24125) now reads demographic pressure. On the current readings the CBD Sentinel scores are Adelaide 13.9, Melbourne 15.7, Perth 21.1, Sydney 22.6, Hobart 26.6, Brisbane City 28.8 and Canberra (City) 30.0, so six of the seven remain below 29. The current APN Social Capital Index™ (24100) readings are Perth 57.2, Brisbane 53.9, Sydney 53.5, Hobart 52.2, Canberra 52.0, Melbourne 47.4 and Adelaide 45.0. The figures in the body are dated readings and stand as published.
Restatement, 12 October 2026. The school counts behind School Density & Sector Mix (24131), a component of APN Meridian™ (Education Value Index) (24130), were rebuilt from the state and territory school registers on 12 October 2026, and Meridian and the APN Social Capital Index™ (24100) were recomputed. On the current readings the CBD Meridian scores are Adelaide 78.8, Melbourne 74.9, Sydney 73.8, Perth 73.5, Hobart 65.7, Brisbane 63.0 and Canberra 62.1, and the composite readings are Perth 57.7, Brisbane 54.3, Sydney 53.4, Canberra 52.2, Hobart 52.2, Melbourne 48.4 and Adelaide 45.0. The figures in the body are dated readings and stand as published.
Further restatement, 12 October 2026. Bonding Capital (Civic Engagement) (24123), a component of APN Sentinel™ (Safety & Sentiment Index) (24120), now reads the rate of volunteering through an organisation alone. Sentinel and the APN Social Capital Index™ (24100) were recomputed. On the current readings the CBD Sentinel scores are Melbourne 17.0, Adelaide 20.2, Sydney 21.6, Perth 25.7, Brisbane 31.2, Hobart 35.8 and Canberra 38.8, so four of the seven are below 29. The composite readings are Perth 58.7, Brisbane 54.7, Hobart 54.0, Canberra 54.0, Sydney 53.3, Melbourne 48.6 and Adelaide 46.3. The figures in the body are dated readings and stand as published.
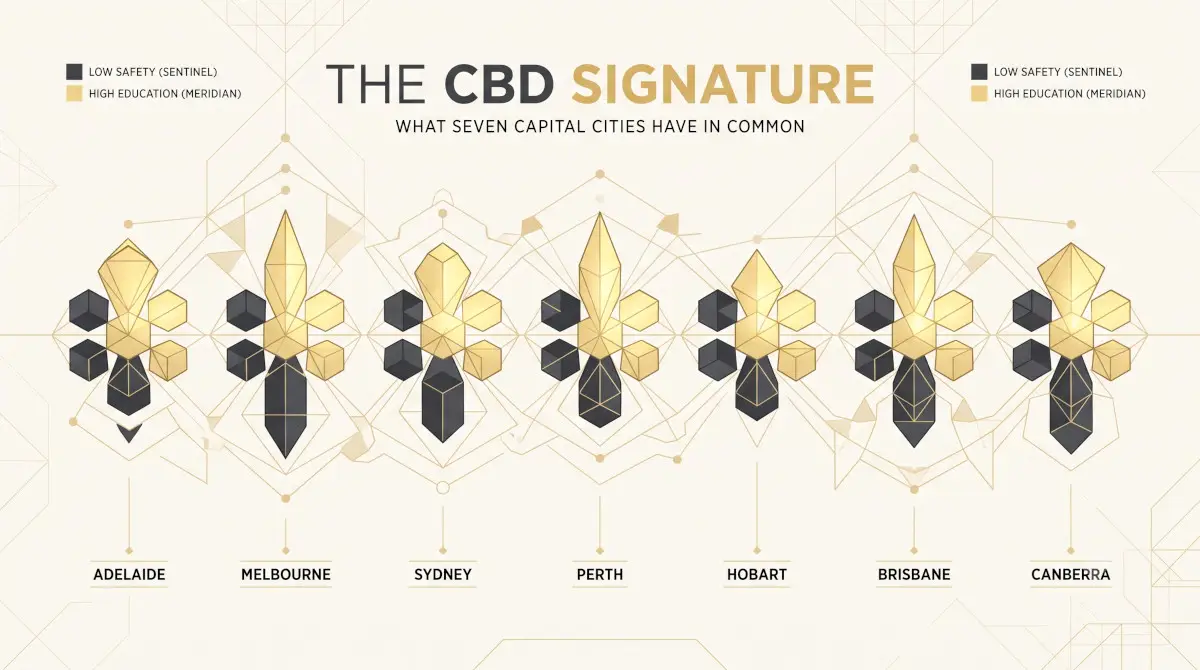
Every Australian capital city has a story it tells about its own centre — glass towers, laneway cafes, the energy of a place people pass through rather than settle in. Using APN Sentinel™ (24120), our safety and sentiment index, every one of the seven mainland and island capital city business districts scores below 29 out of 100 — not one climbs above the national midpoint. Using APN Meridian™ (24130), our education and human capital index, every single one of those same seven CBDs scores above 60. This is not a coincidence appearing once or twice. It is a structural pattern, present in every capital regardless of size, state, or political complexion, and it runs in a precise and repeatable shape.
The Safety Pattern
Adelaide’s CBD sits at 13.5. Melbourne’s at 15.4. Sydney’s at 15.6. Even the strongest of the seven — Brisbane and Canberra, tied at 28.9 — sit comfortably in the bottom third of the national distribution. There is no capital city centre in this dataset that reads as anything other than a low-Sentinel environment.
The Counter-Pattern
Where Sentinel is low, APN Meridian™ tends to be high — not as a strict rank-for-rank inversion (Sydney posts a higher Meridian score than Melbourne despite a very slightly higher Sentinel score too), but as a consistent structural counter-pattern across all seven CBDs. Adelaide’s CBD, the lowest Sentinel score of the seven, posts the highest Meridian score: 78.8, driven by Adelaide University’s city campus, UniSA and TAFE SA all sitting within the same few blocks. The pattern holds even where the margin is tighter: Canberra and Brisbane, the two least-worst Sentinel scores, still clear 60 on Meridian.
All Five Pillars, Side by Side
Reporting Sentinel and Meridian alone tells only part of the story. APN Agora™ (24140), our lived amenity index, follows Meridian’s shape closely — every CBD scores above 59. APN Bedrock™ (24110) and APN Substrate™ (24150) are more varied: Canberra’s CBD posts the only Bedrock score above 50 of the seven, while Substrate ranges from Adelaide’s 35.3 up to Hobart’s 73.1. Setting all five pillars side by side, ordered by their overall APN Social Capital Index™ (24100) composite, shows the full shape at once.
The Full Numbers
The table below sets out every score referenced in this analysis, for readers who want the underlying figures rather than the charted summary.
Why a Single Score Understates the Story
Averaging five pillars into one APN Social Capital Index™ (24100) figure produces a number that describes neither a CBD’s safety profile nor its education density particularly well. Adelaide’s 44.9 sits at the bottom of the composite table — and reading only that figure would miss that the same suburb also posts the single highest Meridian score of any capital measured. A CBD is not a place that scores moderately across every dimension of urban life. It is a place that trades one kind of value for another, and it does so consistently, in every capital examined.
Reading This Against How Slowly the Index Moves
Every pillar behind this piece is built from sources that update on the order of years, not months — the ABS Census cycle, periodic crime collections, largely static hazard mapping. That is a deliberate design choice, not a shortcoming: it is what keeps the index describing structure rather than reacting to short-term noise the way a price series does. It also means the CBD Signature described above is not something to expect movement in from one quarter to the next. What it captures is closer to a durable, structural fact about how the seven capitals are built — where safety, density and education infrastructure sit relative to one another — than a current-conditions snapshot. Read broadly, it says that the trade-off between safety and sentiment on one side and education and human capital on the other is close to a fixed feature of CBD life, not a cyclical one. That makes it a useful tool for understanding what a CBD structurally is, and for explaining why CBD living carries the specific trade-offs it does. It is not a tool for asking whether now is a good time to buy, sell or lease in one.
What This Analysis Does Not Claim
This analysis draws exclusively on APN’s five independent data pillars — Australian Bureau of Statistics Census collections, jurisdictional crime data, ABS geography and remoteness classifications, and hazard datasets sourced from Geoscience Australia and the CSIRO. No property price or transaction data of any kind informs any of the five pillars discussed in this piece. Any relationship between the CBD signature described here and property values is left, deliberately, for separate analysis — not assumed in advance and not implied by anything above.
Methodology Note
Each capital is represented by its single central business district suburb polygon (SAL/SSC grain) — not a metropolitan or greater-capital-city aggregate. Scores are drawn from the live APN Codex as at 29 July 2026: APN Bedrock™ (24110), APN Sentinel™ (24120), APN Meridian™ (24130) and APN Agora™ (24140) are ratified, equal-weighted composites; APN Substrate™ (24150) is ratified and equal-weighted across its five hazard and resilience sub-nodes. All scores are indexed 0–100, with the national median across all suburbs sitting close to 50 for each pillar.