
CBD vs Metro: How Far the Signature Actually Travels
This piece draws on APN’s first release from the 24100 node series — five independent data pillars representing a substantial body of new research across Census, crime, education, amenity and hazard data. At this stage the series should be read as foundational rather than final: the overall composite weighting is still interim, pending formal ratification, and individual sub-components carry their own disclosed limitations. It is best suited to long-horizon location screening, comparative research across suburbs and capitals, and framing structural conversations about what a place durably is — rather than as a live signal for time-sensitive decisions. It should not be read as investment advice, and it is not designed to answer questions about market timing.
The Sentinel (24120) figures in this piece are drawn from the 29 July 2026 data vintage stated in the Methodology Note below. On 9 August 2026, APN harmonised how the Sentinel crime pillar is computed for NSW and SA, bringing them onto the same small-area cascade convention already used by the other five jurisdictions. This moved every CBD-vs-metro figure quoted here at least slightly, including Sydney (CBD 15.6 → 18.0, Metro 47.3 → 50.9, gap +31.7 → +32.9) and Adelaide (CBD 13.5 → 13.4, Metro 44.1 → 43.0, gap +30.6 → +29.6); Perth also moved (CBD 21.1 → 20.4, Metro 37.6 → 38.0, gap +16.5 → +17.6) as a downstream effect of the national percentile re-basing this triggered. The pattern and conclusions described in this piece are unaffected, but the specific figures quoted are a historical snapshot, not the current live reading.
Correction, October 2026. The APN Bedrock™ (24110) figures in this piece are restated on Bedrock methodology v1.1, which joins every Census figure to its locality by the ABS suburb code, reads unemployment for all persons and reads the SEIFA advantage and disadvantage index (IRSAD). The other four pillars remain at the 29 July 2026 vintage, and each APN Social Capital Index™ (24100) figure is the mean of the five pillar figures shown.
Restatement, 11 October 2026. APN Sentinel™ (Safety & Sentiment Index) (24120) was rebuilt on 11 October 2026. Recorded crime rates now use the ABS estimated resident population at 30 June 2025 and count the same offences in every state and territory, and the Demographic Tension Index (24125) now reads demographic pressure. On the current readings the Sentinel scores, CBD against metro, are Sydney 22.6 and 54.2 (a gap of 31.6), Melbourne 15.7 and 45.7 (a gap of 30.0), Brisbane 28.8 and 44.4 (a gap of 15.6), Perth 21.1 and 42.4 (a gap of 21.3), Adelaide 13.9 and 45.6 (a gap of 31.7), Canberra 30.0 and 56.4 (a gap of 26.4) and Hobart 26.6 and 45.1 (a gap of 18.5). Adelaide now shows the widest gap and Brisbane the narrowest. The current APN Social Capital Index™ (24100) readings, CBD against metro, are Sydney 53.5 and 55.6, Melbourne 47.4 and 53.9, Brisbane 53.9 and 56.8, Perth 57.2 and 51.7, Adelaide 45.0 and 48.2, Canberra 52.0 and 59.7 and Hobart 52.2 and 56.1; Perth remains the only capital whose CBD reads above its metro. The figures in the body are dated readings and stand as published.
Restatement, 12 October 2026. The school counts behind School Density & Sector Mix (24131), a component of APN Meridian™ (Education Value Index) (24130), were rebuilt from the state and territory school registers on 12 October 2026, and Meridian and the APN Social Capital Index™ (24100) were recomputed. On the current readings the Meridian scores, CBD against metro, are Sydney 73.8 and 58.9, Melbourne 74.9 and 64.1, Brisbane 63.0 and 63.7, Perth 73.5 and 53.1, Adelaide 78.8 and 57.5, Canberra 62.1 and 63.9 and Hobart 65.7 and 61.8. The composite readings, CBD against metro, are Sydney 53.4 and 55.3, Melbourne 48.4 and 54.2, Brisbane 54.3 and 57.2, Perth 57.7 and 52.1, Adelaide 45.0 and 48.3, Canberra 52.2 and 59.9 and Hobart 52.2 and 56.1; Perth remains the only capital whose CBD reads above its metro. The figures in the body are dated readings and stand as published.
Further restatement, 12 October 2026. Bonding Capital (Civic Engagement) (24123), a component of APN Sentinel™ (Safety & Sentiment Index) (24120), now reads the rate of volunteering through an organisation alone. Sentinel and the APN Social Capital Index™ (24100) were recomputed. On the current readings the Sentinel scores, CBD against metro, are Sydney 21.6 and 52.3, Melbourne 17.0 and 42.9, Brisbane 31.2 and 44.5, Perth 25.7 and 41.6, Adelaide 20.2 and 44.5, Canberra 38.8 and 57.3 and Hobart 35.8 and 46.2. The composite readings, CBD against metro, are Sydney 53.3 and 54.9, Melbourne 48.6 and 53.7, Brisbane 54.7 and 57.2, Perth 58.7 and 51.9, Adelaide 46.3 and 48.1, Canberra 54.0 and 60.0 and Hobart 54.0 and 56.3; Perth remains the only capital whose CBD reads above its metro. The figures in the body are dated readings and stand as published.
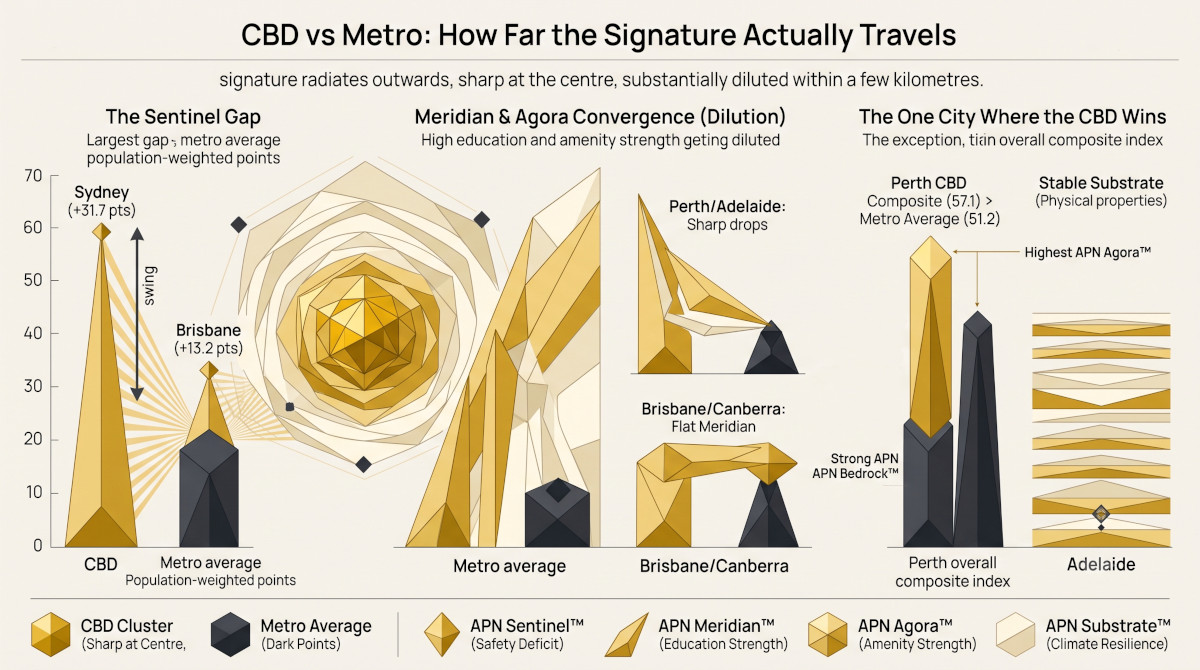
The CBD Signature holds in every capital — low APN Sentinel™, high APN Meridian™ and APN Agora™, a specific trade of safety and sentiment for education and amenity. The question this piece asks is how far that signature actually reaches. Population-weighting every suburb across each capital’s full statistical area and comparing the result against the CBD alone shows a signature that is, in most cases, a genuinely local phenomenon — sharp at the centre, and substantially diluted within a few kilometres of it.
The Sentinel Gap
Every capital’s Sentinel score rises once the metro area is included — without exception, and in most cases by a wide margin. Sydney shows the largest gap of any capital: 15.6 in the CBD against 47.3 across the metro, a 31.7-point swing. Adelaide is close behind at 30.6 points. Brisbane shows the smallest gap of the seven, at 13.2 points. That is not simply a function of starting closer to the metro average: Canberra’s CBD carries an identical Sentinel score (28.9) but a gap of 21.1 points, more than four times the size — so what keeps Brisbane’s CBD Sentinel score comparatively close to its metro while Canberra’s pulls away sharply is a genuine open question this dataset does not resolve on its own.
Meridian and Agora Converge Toward the Middle
Where the CBD Signature’s safety deficit gets diluted by the metro, its education and amenity strength gets diluted the same way, in the opposite direction. Meridian falls from CBD to metro in five of seven capitals — most sharply in Perth (70.8 down to 51.4, a 19.4-point drop) and Adelaide (78.8 down to 56.9, 21.9 points). Two capitals break the pattern: Brisbane and Canberra both show Meridian essentially flat, or very marginally higher, across the metro than the CBD — in both cities, university and TAFE infrastructure is evidently distributed more evenly across the wider metro rather than concentrated in the centre the way it is in Perth, Adelaide, Sydney, Melbourne and Hobart. Agora follows the diluting pattern in every capital without exception, dropping by 5.5 to 26.3 points once the full metro is included — Canberra shows the smallest drop, Perth the largest.
The One City Where the CBD Wins
Across the APN Social Capital Index™ (24100) composite, six of seven capitals score higher across their metro than in their CBD alone — Canberra’s metro beats its CBD by 6.6 points, Melbourne’s by 5.4. Perth is the sole exception. Its CBD composite (57.2) sits 6.4 points above its own metro average (50.8), the only capital in the dataset where the centre outperforms its surrounds rather than the other way around. Perth’s CBD carries an unusually strong APN Bedrock™ score for a city centre (49.3, clear of Sydney’s 43.1 and well above Melbourne’s 30.6) alongside the highest APN Agora™ score of any CBD measured — a combination none of the other six capitals reproduce.
Substrate Barely Moves
One pillar breaks from the general dilution pattern almost entirely. APN Substrate™ (24150), APN’s climate resilience and hazard exposure index, stays close to flat between CBD and metro in most capitals — Sydney (63.7 vs 63.2), Melbourne (59.1 vs 59.8) and Brisbane (69.1 vs 70.2) all sit within a point of each other. That makes sense given what Substrate actually measures: flood extent, bushfire history, seismic hazard and protected-area coverage are physical and geographic properties of a place, not social or economic ones, and they do not shift with population density or CBD-adjacency the way the other four pillars do. Adelaide is the exception worth flagging — its CBD Substrate score (35.3) sits 11.7 points below its metro average (47.0), the widest Substrate gap of any capital, and consistent with the earlier finding that Adelaide’s CBD carries unusually poor Substrate coverage relative to the rest of the city.
The Full Comparison
Every score referenced in this analysis, CBD and metro side by side, for all five pillars and the overall composite.
What This Analysis Does Not Claim
This analysis draws exclusively on APN’s five independent data pillars — Australian Bureau of Statistics Census collections, jurisdictional crime data, ABS geography and remoteness classifications, and hazard datasets sourced from Geoscience Australia and the CSIRO. No property price or transaction data of any kind informs any of the five pillars discussed in this piece.
Methodology Note
CBD figures use each capital’s single central business district suburb polygon, as in the companion CBD Signature piece. Metro figures are population-weighted averages across every geography within each capital’s ABS Statistical Area Level 4 (SA4) regions — the standard ABS statistical geography, though not identical to Greater Capital City Statistical Area (GCCSA) boundaries some readers may expect. Canberra uses the whole of the Australian Capital Territory SA4, the closest available equivalent. Metro population totals: Sydney 4,489,410; Melbourne 4,189,875; Brisbane 1,197,635; Perth 1,845,661; Adelaide 1,291,027; Canberra 395,853; Hobart 220,313. Scores are drawn from the live APN Codex as at 29 July 2026, on the same ratified, equal-weighted basis as the companion CBD Signature piece.