
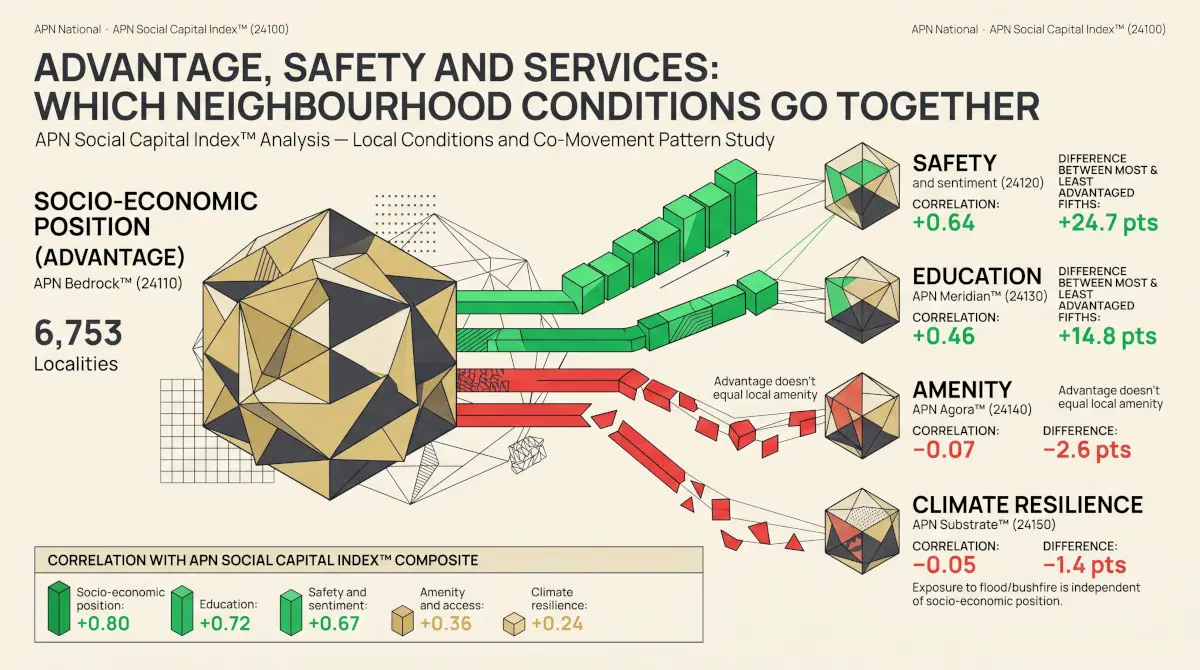

Australia’s more advantaged localities also tend to rank higher on safety and on education, but not on local amenity or on resilience to natural hazards. Across 6,782 localities with more than 200 residents, the fifth ranking highest on socio-economic position averaged 25.1 points higher on the safety pillar, APN Sentinel™ (Safety & Sentiment Index) (24120), and 15.1 points higher on the education pillar, APN Meridian™ (Education Value Index) (24130), than the fifth ranking lowest. On amenity and access the most advantaged fifth averaged 3.8 points lower, and on climate resilience 1.4 points lower. Advantage, safety and education move together; amenity and hazard follow a pattern of their own.
Every reading is built from a locality’s rank against other localities nationally, not from measures of absolute conditions.
Five conditions around home
The APN Social Capital Index™ (Composite) (24100) scores each suburb and locality on five pillars. Socio-economic position, APN Bedrock™ (Socio-Economic Position) (24110), draws on income, housing tenure, employment, household finances and socio-economic advantage from the 2021 Census. Safety and sentiment, APN Sentinel™ (Safety & Sentiment Index) (24120), combines recorded crime with civic engagement, housing security, demographic change and acute vulnerability. Education, APN Meridian™ (Education Value Index) (24130), covers schools, tertiary institutions, qualifications, childcare and advancement velocity (24134). Amenity and access, APN Agora™ (Amenity & Access Index) (24140), covers gathering places, transport, internet access, green space and services. Climate resilience, APN Substrate™ (Climate Resilience Rating) (24150), reads mapped exposure to flood, bushfire and other natural hazards, with higher readings meaning less exposure.
Each pillar averages several measures, and each measure is a national percentile rank: a locality’s position against other localities across Australia, from 0 to 100. The composite is the average of the five pillars. This piece asks which of the five tend to go together.
Which conditions move together
| Socio-economic position | Safety and sentiment | Education | Amenity and access | Climate resilience | |
|---|---|---|---|---|---|
| Socio-economic position | — | 0.64 | 0.46 | −0.09 | −0.05 |
| Safety and sentiment | 0.64 | — | 0.29 | −0.14 | 0.00 |
| Education | 0.46 | 0.29 | — | 0.30 | 0.03 |
| Amenity and access | −0.09 | −0.14 | 0.30 | — | 0.04 |
| Climate resilience | −0.05 | 0.00 | 0.03 | 0.04 | — |
Pearson correlation between pillar readings across localities with more than 200 residents. Pillar readings average national percentile ranks of localities, 0 to 100, higher meaning stronger conditions. APN calculation based on Australian Bureau of Statistics and other public data.
A correlation of 1 would mean two pillars rank localities identically, and 0 that they are unrelated. The strongest relationship is between socio-economic position and safety, at 0.64, followed by socio-economic position and education, at 0.46. Amenity has a modest positive relationship with education (0.30) and a slight negative one with socio-economic position (−0.09). Climate resilience is close to unrelated to every other pillar.
From the least to the most advantaged localities
| Socio-economic position | Localities | Safety and sentiment | Education | Amenity and access | Climate resilience | Composite |
|---|---|---|---|---|---|---|
| Lowest fifth (0.5–30.7) | 1,357 | 34.5 | 43.3 | 42.9 | 64.0 | 41.0 |
| Second fifth (30.7–44.7) | 1,357 | 41.2 | 49.9 | 42.3 | 64.0 | 47.1 |
| Middle fifth (44.7–56.7) | 1,356 | 45.9 | 53.3 | 41.7 | 64.4 | 51.2 |
| Fourth fifth (56.7–68.9) | 1,356 | 51.3 | 55.5 | 40.7 | 63.4 | 54.7 |
| Highest fifth (68.9–97.0) | 1,356 | 59.6 | 58.4 | 39.1 | 62.6 | 59.5 |
Average pillar reading for localities in each fifth of the socio-economic position pillar, localities with more than 200 residents. Pillar readings average national percentile ranks of localities, 0 to 100, higher meaning stronger conditions. APN calculation based on Australian Bureau of Statistics and other public data.
Difference between the most and least advantaged fifths of localities, by pillar
Average reading in the highest fifth of localities on socio-economic position, less the average in the lowest fifth. Pillar readings average national percentile ranks of localities, 0 to 100, higher meaning stronger conditions. APN calculation based on Australian Bureau of Statistics and other public data.
Grouping localities into fifths by socio-economic position shows the same pattern step by step. Safety and sentiment rises in every fifth, from 34.5 to 59.6, and education from 43.3 to 58.4. Amenity and access eases slightly in every fifth, from 42.9 to 39.1, and climate resilience stays between 62.6 and 64.4. More advantaged localities rank slightly lower than others on amenity and access, and no higher on climate resilience.
What drives the composite
Correlation of each pillar with the APN Social Capital Index™ composite
Correlation of each pillar with the composite across localities with more than 200 residents. APN Social Capital Index™ (24100). APN calculation based on Australian Bureau of Statistics and other public data.
Because three pillars move together, they carry more of the composite than their equal weights suggest. Socio-economic position correlates with the composite at 0.80, education at 0.72 and safety at 0.68; amenity (0.35) and climate resilience (0.24) much less. A high composite reading therefore says most about advantage, safety and education, and a locality’s amenity and hazard exposure need to be read from their own pillars. How the pillars differ between capital-city centres and their suburbs is set out in The CBD Signature: What Seven Capital Cities Have in Common.
What this does not show
The readings are built from ranks, so they show where a locality sits relative to others, not whether its conditions are good or poor in absolute terms. Part of the link between socio-economic position, safety and education comes from shared sources: several safety and education measures draw on the same 2021 Census as the socio-economic pillar, so the correlations are not fully independent. Crime data come from different agencies in each state and territory, at different geographic levels and for different years, which is one reason this piece does not compare states. Climate resilience reads highest where no hazard is mapped, and absence of mapping is not the same as absence of risk. A correlation describes a tendency across thousands of localities; many individual places depart from it. Nothing here implies that one condition causes another.
APN Sentinel™ (Safety & Sentiment Index) (24120) was rebuilt on 11 October 2026. Recorded crime rates now use the ABS estimated resident population at 30 June 2025 and count the same offences in every state and territory, and the Demographic Tension Index (24125) now reads demographic pressure. The APN Social Capital Index™ (24100) was recomputed with it. On the current readings the most advantaged fifth of localities averages 23.1 points higher on the safety pillar than the least advantaged fifth (60.2 against 37.1), and safety still rises in every fifth. Socio-economic position and safety correlate at 0.62. The pillars correlate with the composite at 0.79 for socio-economic position, 0.72 for education, 0.67 for safety, 0.37 for amenity and 0.23 for climate resilience. The figures in the body are dated readings and stand as published.
Restatement, 12 October 2026. The school counts behind School Density & Sector Mix (24131), a component of APN Meridian™ (Education Value Index) (24130), were rebuilt from the state and territory school registers on 12 October 2026, and Meridian and the APN Social Capital Index™ (24100) were recomputed. On the current readings, across 6,787 localities, the most advantaged fifth averages 15.2 points higher on the education pillar than the least advantaged fifth (59.0 against 43.8), and education still rises in every fifth. Socio-economic position and education correlate at 0.47. The pillars correlate with the composite at 0.80 for socio-economic position, 0.70 for education, 0.66 for safety, 0.37 for amenity and 0.22 for climate resilience. The figures in the body are dated readings and stand as published.
Further restatement, 12 October 2026. Bonding Capital (Civic Engagement) (24123), a component of APN Sentinel™ (Safety & Sentiment Index) (24120), now reads the rate of volunteering through an organisation alone. Sentinel and the APN Social Capital Index™ (24100) were recomputed. On the current readings, across 6,787 localities, the most advantaged fifth averages 24.9 points higher on the safety pillar than the least advantaged fifth (60.7 against 35.8), and safety still rises in every fifth. Socio-economic position and safety correlate at 0.62. The pillars correlate with the composite at 0.80 for socio-economic position, 0.69 for education, 0.68 for safety, 0.36 for amenity and 0.22 for climate resilience. The figures in the body are dated readings and stand as published.
- Australian Bureau of Statistics (Reference period: 2021) Census of Population and Housing [https://www.abs.gov.au/census], ABS Website, accessed 7 October 2026.
ABS material is used under a Creative Commons Attribution 4.0 International licence. Calculations, standardisations and index readings are APN’s and are not attributable to the ABS.
Findings are presented on the basis of data and evidence alone.


