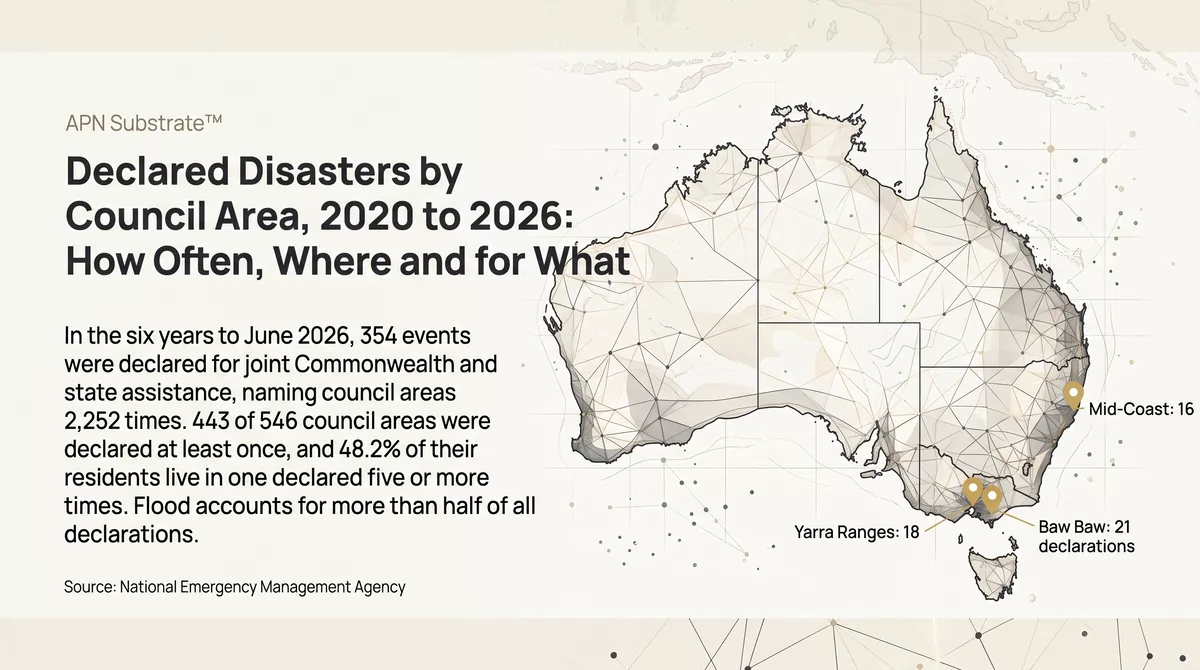

In the six years to June 2026, 354 events were declared for joint Commonwealth and state assistance, 350 of them floods, storms, bushfires or cyclones, and council areas were named in them 2,252 times. 443 of the country’s 546 council areas were declared at least once. Almost half of their residents (48.2%) live in a council area declared five or more times, and 15.0% in one never declared. Flood accounts for more than half of all declarations.
A declaration is an administrative act that opens government assistance. It is not a measure of damage.
What is measured
The Disaster Recovery Funding Arrangements are a cost-sharing arrangement between the Commonwealth and the states and territories, under which assistance is opened after a natural disaster or a terrorist act. Each activation names the council areas it covers. The National Emergency Management Agency publishes the list.
This article counts those entries for events that started between 1 July 2020 and 30 June 2026. An event is one activation. A declaration is one council area named in one event, so a flood that covers 60 council areas is one event and 60 declarations. The agency’s listing gives the dataset a reference period starting in 2006. The file dated 11 August 2026 does not go back that far: its earliest event is from September 2017, and it holds 24 events before July 2020 and none of the 2019–20 bushfire season, so those years cannot be counted from it and are left out. A declaration covers a whole council area whatever share of it was affected, and it shows that assistance was opened, not how much damage was done.
By hazard
Council-area declarations by hazard, July 2020 to June 2026
APN calculation based on National Emergency Management Agency data: DRFA Activation History by LGA, events starting 1 July 2020 to 30 June 2026, file of 11 August 2026. Council-area declarations by hazard, with the number of separate events beside each bar. A declaration is one council area named in one event activated under the Disaster Recovery Funding Arrangements. Events are grouped by the hazard the agency lists; an event listed with two hazards is counted under cyclone, bushfire, flood, then storm, in that order.
Flood accounts for 1,149 of the 2,252 declarations, 51% of the total, though floods were 88 of the 354 events. The other four events were three earthquakes and one terrorist attack, with five declarations between them. A flood event named 13.1 council areas on average and a cyclone 10.7. Storms and bushfires are the most numerous events, at 134 and 109, but each covers fewer council areas: 4.4 and 2.8 on average.
| Year to June | Flood | Storm | Bushfire | Cyclone | Other | All |
|---|---|---|---|---|---|---|
| 2020–21 | 166 | 111 | 18 | 44 | 0 | 339 |
| 2021–22 | 357 | 133 | 3 | 10 | 2 | 505 |
| 2022–23 | 262 | 37 | 28 | 7 | 0 | 334 |
| 2023–24 | 105 | 70 | 114 | 69 | 0 | 358 |
| 2024–25 | 146 | 143 | 42 | 40 | 2 | 373 |
| 2025–26 | 113 | 100 | 95 | 34 | 1 | 343 |
| Six years | 1,149 | 594 | 300 | 204 | 5 | 2,252 |
APN calculation based on National Emergency Management Agency data: DRFA Activation History by LGA, events starting 1 July 2020 to 30 June 2026, file of 11 August 2026. Council-area declarations by the financial year in which the event started. Other is three earthquakes and one terrorist attack. A declaration is one council area named in one event activated under the Disaster Recovery Funding Arrangements. Events are grouped by the hazard the agency lists; an event listed with two hazards is counted under cyclone, bushfire, flood, then storm, in that order.
The year to June 2022 had the most declarations, 505, of which 357 were for flood. Flood declarations were highest in 2021–22 and bushfire declarations in 2023–24, at 114.
The largest events
| Event | Council areas declared |
|---|---|
| New South Wales storms and floods, from 10 March 2021 | 79 |
| New South Wales flooding, from 14 September 2022 | 76 |
| Victorian floods, from 6 October 2022 | 65 |
| Queensland monsoon trough and Cyclones Koji and Narelle, 24 December 2025 to 24 April 2026 | 65 |
| New South Wales flooding, from 22 February 2022 | 62 |
| New South Wales flooding, from 9 November 2021 | 62 |
APN calculation based on National Emergency Management Agency data: DRFA Activation History by LGA, events starting 1 July 2020 to 30 June 2026, file of 11 August 2026. The six events that named the most council areas, described from the agency’s event names and dates. The fifth and sixth each named 62.
Five of the six events that named the most council areas were floods in New South Wales and Victoria in 2021 and 2022. The sixth, in Queensland, combined a monsoon trough and two cyclones and is listed by the agency as a flood.
How often council areas are declared
Council areas by number of declarations, July 2020 to June 2026
APN calculation based on National Emergency Management Agency data: DRFA Activation History by LGA, events starting 1 July 2020 to 30 June 2026, file of 11 August 2026. The 546 council areas with a population estimate, by number of declarations, with the share of their residents beside each bar. Residents are the ABS estimated resident population at 30 June 2025 (Regional Population, 2024–25). The Australian Capital Territory, which has no council areas, is not included.
103 council areas were not declared in the six years, and they hold 15.0% of residents. At the other end, 59 council areas were declared ten or more times, and they hold 18.7% of residents. A further 159 were declared between five and nine times.
State by state
Share of residents in a council area declared five or more times, by state
APN calculation based on National Emergency Management Agency data: DRFA Activation History by LGA, events starting 1 July 2020 to 30 June 2026, file of 11 August 2026. Share of each state’s residents living in a council area declared five or more times; the share living in a council area never declared is shown beside each bar. Residents are the ABS estimated resident population at 30 June 2025 (Regional Population, 2024–25).
| State or territory | Council areas | With no declaration | Declarations | Separate events |
|---|---|---|---|---|
| New South Wales | 129 | 7 | 770 | 142 |
| Victoria | 80 | 2 | 436 | 53 |
| Queensland | 78 | 0 | 637 | 73 |
| South Australia | 71 | 28 | 65 | 7 |
| Western Australia | 139 | 65 | 176 | 45 |
| Tasmania | 29 | 0 | 73 | 13 |
| Northern Territory | 20 | 1 | 91 | 17 |
| Australian Capital Territory | – | – | 4 | 4 |
APN calculation based on National Emergency Management Agency data: DRFA Activation History by LGA, events starting 1 July 2020 to 30 June 2026, file of 11 August 2026. Council areas, council areas with no declaration, declarations and separate events, by state and territory. The Australian Capital Territory has no council areas and is listed as a single area.
The states differ very widely. In Queensland every council area was declared at least once, 97.2% of residents live in one declared five or more times, and 61.5% in one declared ten or more times. In South Australia and Western Australia most residents live in a council area that was never declared: 58.2% and 66.9%.
Part of that difference is the weather and part is administration. Queensland had 73 separate events in the six years and Victoria 53, against 7 in South Australia. States decide when to seek activation and how to divide a season of weather into events, so the counts are not a like-for-like measure of hazard between states.
The council areas declared most often
| Council area | State | Declarations | Flood | Storm | Bushfire | Cyclone or other | Residents, June 2025 |
|---|---|---|---|---|---|---|---|
| Baw Baw | Vic. | 21 | 3 | 16 | 2 | 0 | 62,784 |
| Yarra Ranges | Vic. | 18 | 6 | 10 | 2 | 0 | 160,906 |
| Mid-Coast | NSW | 16 | 4 | 5 | 6 | 1 | 99,448 |
| East Gippsland | Vic. | 16 | 6 | 7 | 3 | 0 | 49,669 |
| Wellington | Vic. | 16 | 4 | 8 | 3 | 1 | 46,551 |
| Bega Valley | NSW | 15 | 7 | 6 | 2 | 0 | 36,921 |
| South Gippsland | Vic. | 15 | 4 | 10 | 1 | 0 | 31,109 |
| Wingecarribee | NSW | 14 | 7 | 7 | 0 | 0 | 53,840 |
| Macedon Ranges | Vic. | 13 | 4 | 6 | 3 | 0 | 54,464 |
| Balonne | Qld | 13 | 9 | 1 | 2 | 1 | 4,350 |
| Scenic Rim | Qld | 13 | 4 | 5 | 2 | 2 | 46,947 |
| Toowoomba | Qld | 13 | 5 | 1 | 5 | 2 | 186,276 |
| Western Downs | Qld | 13 | 7 | 0 | 5 | 1 | 35,452 |
APN calculation based on National Emergency Management Agency data: DRFA Activation History by LGA, events starting 1 July 2020 to 30 June 2026, file of 11 August 2026. The thirteen council areas declared 13 or more times. Cyclone or other includes one earthquake. Residents are the ABS estimated resident population at 30 June 2025 (Regional Population, 2024–25).
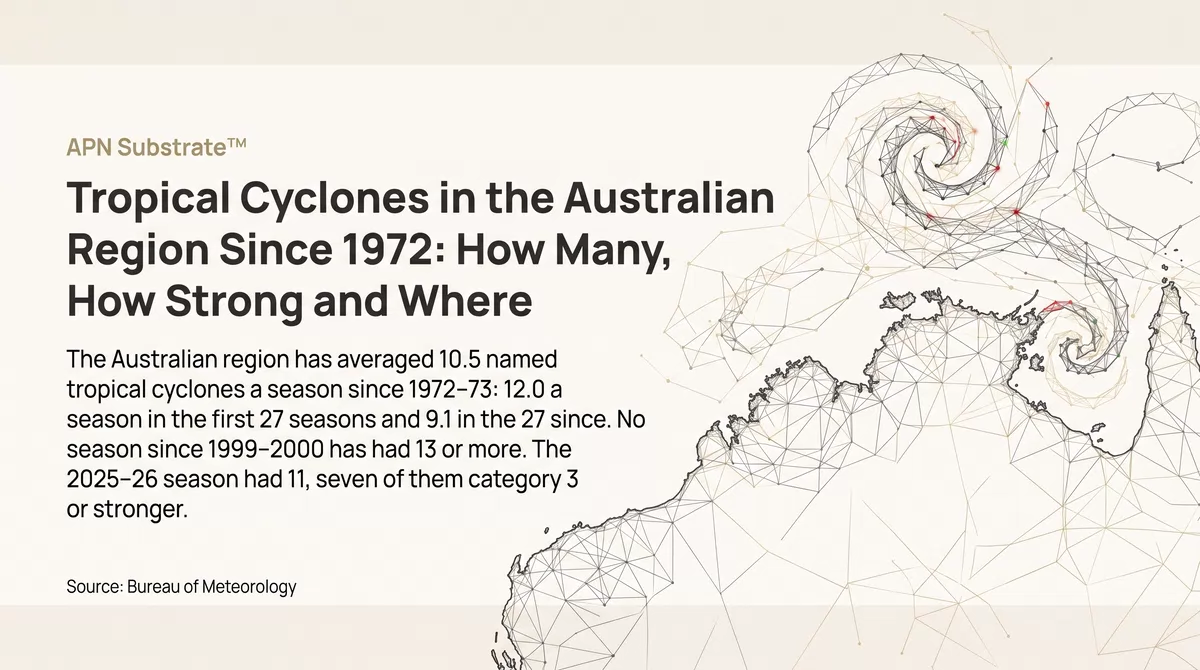
Six of the thirteen are in Victoria, most of them in Gippsland and the ranges east of Melbourne, where storm, flood and bushfire declarations all occur. Companion articles set out the history of tropical cyclones in the Australian region since 1972, and cover flood declarations, bushfire declarations and storm declarations over the same six years.
What this does not show
A declaration is not a measure of damage or of risk to any property. It covers a whole council area, so a large rural shire and a small suburban council each count once, and a council area can be declared for an event that touched one corner of it. The count depends on each state’s practice in seeking activation and in defining an event. Six years is a short period. The figures say nothing about what assistance was paid, and nothing about events that were not declared.
- Australian Bureau of Statistics (Reference period: 2024–25) Regional Population [https://www.abs.gov.au/statistics/people/population/regional-population/latest-release], ABS Website, accessed 13 October 2026.
- National Emergency Management Agency (Reference period: events to June 2026) DRFA Activation History by LGA (file of 11 August 2026) [https://data.gov.au/data/dataset/drfa-activation-history-by-lga], accessed 13 October 2026.
National Emergency Management Agency material is used under a Creative Commons Attribution 2.5 Australia licence. ABS material is used under a Creative Commons Attribution 4.0 International licence. Calculations, standardisations and index readings are APN’s and are not attributable to the ABS.
Disclaimer
The analysis and information contained in this publication are for general informational and strategic purposes only and do not constitute financial, investment, legal, or any other form of professional advice. Australian Property Network is not a licensed financial advisor. Property values and market conditions can go up or down. Before making any property or investment decisions, you must conduct your own thorough research and seek independent professional advice tailored to your specific circumstances. Images are for illustrative purposes only. E.&O.E.
Findings are presented on the basis of data and evidence alone.