
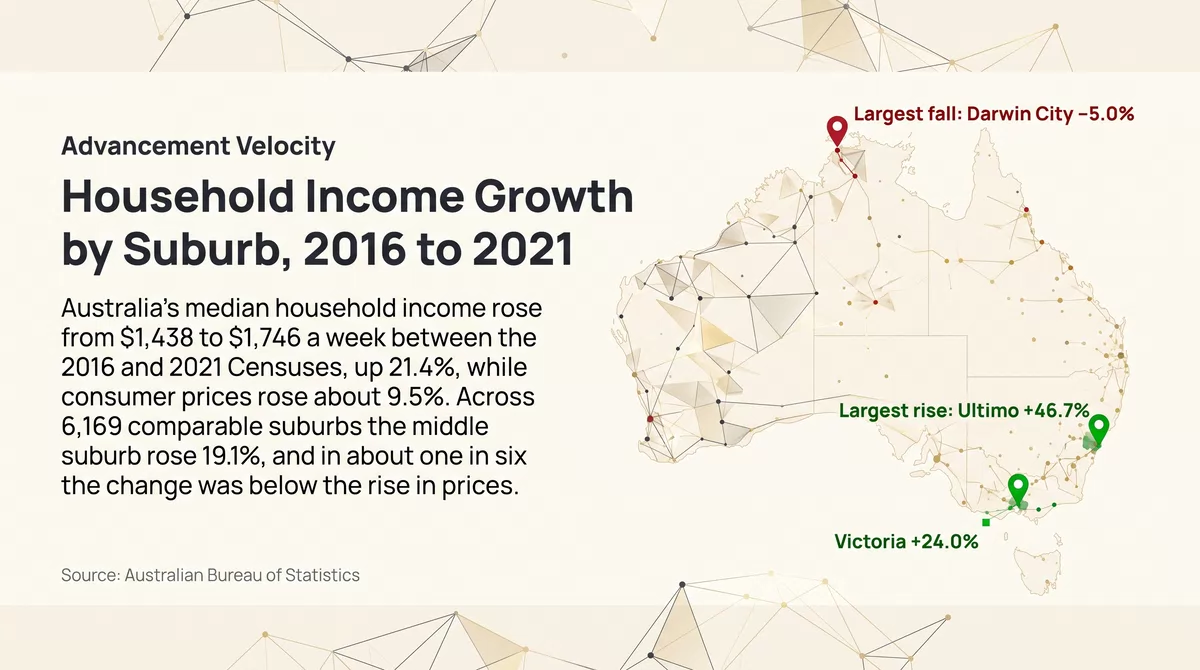

Between the 2016 and 2021 Censuses, Australia’s median household income rose from $1,438 to $1,746 a week, an increase of 21.4%, while consumer prices rose by about 9.5%. Suburb by suburb the picture is less even. Across 6,169 suburbs whose boundaries did not change, the middle suburb’s median rose 19.1%; in about one suburb in six the change was below the rise in prices, and in 263 it fell. Growth was similar across most of the income range and lower in the highest-income fifth of suburbs.
Incomes are in the dollars of each Census year and are before tax.
What is measured
The Census asks each person for their income, and the ABS publishes the median total household income for every suburb: the level that half of households are above and half below. This article compares that median at the 2016 and 2021 Censuses. The figures are before tax and in the dollars of each year, so part of every increase is the general rise in prices, about 9.5% on the Consumer Price Index between the September quarters of 2016 and 2021. After allowing for that, the national median rose by about 11%.
A suburb’s median is a description of whoever lived there on Census night. It changes when residents’ incomes change and also when the residents themselves change, so growth in a suburb’s median is not the pay rise of the people who lived there in 2016.
Australia and the states
Change in median household income, 2016 to 2021, by state and territory
APN calculation based on Australian Bureau of Statistics data: Census of Population and Housing, 2016 and 2021, Time Series Profile, table T02 (selected medians and averages). Change in median total household income, dollars a week, between the 2016 and 2021 Censuses, with the two medians in brackets. Current dollars.
Victoria (24.0%), Tasmania (23.5%) and New South Wales (23.1%) recorded the largest increases, and Western Australia (13.8%) and the Northern Territory (3.9%) the smallest. The Northern Territory is the only state or territory where the median rose by less than consumer prices. Levels still differ widely: the 2021 median was $2,373 a week in the Australian Capital Territory and $1,358 in Tasmania. Nationally, growth over these five years (21.4%) was faster than over the five before (16.5% from 2011 to 2016).
Which suburbs can be compared
Suburb boundaries changed between the two Censuses. This article uses the ABS’s published correspondence between the 2016 and 2021 boundaries and keeps only suburbs whose area is the same at both, that had more than 200 residents at both, and for which a median was published at both. That leaves 6,169 suburbs, home to about 82% of the 2021 population. The Census and the Time Series Profile figures above cover everyone; the suburb figures below cover this group.
How suburbs are spread
Number of suburbs by change in median household income, 2016 to 2021
APN calculation based on Australian Bureau of Statistics data: Census of Population and Housing, 2016 and 2021, General Community Profile, table G02 (selected medians and averages), 2016 State Suburbs and 2021 Suburbs and Localities. The 6,169 suburbs with unchanged boundaries and more than 200 residents at both Censuses, by the change in median household income, with the share of their residents in each group. Current dollars.
In the middle suburb the median rose 19.1%. About 82% of the residents of these suburbs live where it rose by between 10% and 30%. At the lower end, 1,084 suburbs saw an increase of less than 10%, no change or a fall, and in 16% of suburbs the median grew by less than consumer prices or fell. At the upper end, 312 suburbs recorded 40% or more; most are small, and together they hold 1.3% of these suburbs’ residents.
By the level of income a suburb started from
Change in median household income, 2016 to 2021, by fifths of suburbs ranked on 2016 income
APN calculation based on Australian Bureau of Statistics data: Census of Population and Housing, 2016 and 2021, General Community Profile, table G02 (selected medians and averages), 2016 State Suburbs and 2021 Suburbs and Localities. Suburbs ranked by median household income in 2016 and divided into five equal groups; the bar is the change in the median for the middle suburb of each group. Current dollars.
Suburbs in the lower four-fifths of the 2016 income range grew at similar rates, between 18.8% and 20.8% for the middle suburb of each group. The highest-income fifth, those with a 2016 median of $1,834 a week or more, grew more slowly, at 16.1%. In dollars the order is different: 16.1% of a high median is a larger weekly amount than 18.8% of a low one.
By size of place
Change in median household income, 2016 to 2021, by the size of the suburb
APN calculation based on Australian Bureau of Statistics data: Census of Population and Housing, 2016 and 2021, General Community Profile, table G02 (selected medians and averages), 2016 State Suburbs and 2021 Suburbs and Localities. Change in median household income for the middle suburb of each group. Suburbs grouped by their number of residents in 2021. Current dollars.
The size of a place made little difference: the middle suburb’s increase was within about two percentage points across all four size groups. State mattered more. The middle suburb rose 22.3% in Victoria, 12.1% in Western Australia and 4.6% in the Northern Territory.
The largest and smallest changes among larger suburbs
The lists below are limited to 1,150 suburbs with at least 5,000 residents at both Censuses whose resident count did not change sharply, which leaves out new estates and districts transformed by new building.
| Suburb | State | Median 2016 | Median 2021 | Change in median | Change in residents |
|---|---|---|---|---|---|
| Ultimo | NSW | $1,230 | $1,805 | 46.7% | −16.2% |
| Clayton | Vic. | $1,051 | $1,494 | 42.2% | −1.9% |
| Bentley | WA | $863 | $1,212 | 40.4% | 3.1% |
| Kilburn | SA | $840 | $1,179 | 40.4% | 3.7% |
| Palm Beach | Qld | $1,228 | $1,721 | 40.1% | 11.6% |
| Moonah | Tas. | $1,015 | $1,421 | 40.0% | 8.5% |
| Burwood | Vic. | $1,209 | $1,684 | 39.3% | 0.9% |
| North Melbourne | Vic. | $1,236 | $1,717 | 38.9% | 0.1% |
| South Coogee | NSW | $1,517 | $2,105 | 38.8% | 2.0% |
| Braybrook | Vic. | $1,051 | $1,451 | 38.1% | 5.3% |
The ten largest increases are spread across six states. Several are districts with a university campus in or beside them, among them Ultimo, Clayton, Bentley and Burwood. Ultimo’s resident count fell by 16% between the two Censuses, at a time when the international border was closed; Clayton’s was little changed (down 1.9%). Where residents on low incomes leave, a suburb’s median can rise without any household being paid more; the Census medians do not show whether that happened here.
| Suburb | State | Median 2016 | Median 2021 | Change in median | Change in residents |
|---|---|---|---|---|---|
| Darwin City | NT | $2,264 | $2,151 | −5.0% | 10.6% |
| Clinton | Qld | $1,721 | $1,701 | −1.2% | 4.2% |
| Greenfield Park | NSW | $1,489 | $1,477 | −0.8% | 5.9% |
| New Auckland | Qld | $2,021 | $2,009 | −0.6% | 3.6% |
| Tannum Sands | Qld | $2,002 | $2,035 | 1.6% | 1.6% |
| Wetherill Park | NSW | $1,525 | $1,556 | 2.0% | 4.7% |
| Bossley Park | NSW | $1,511 | $1,542 | 2.1% | 6.2% |
| Loganlea | Qld | $1,243 | $1,282 | 3.1% | 19.1% |
| Carey Park | WA | $986 | $1,018 | 3.2% | −0.3% |
| Biloela | Qld | $1,820 | $1,884 | 3.5% | −1.1% |
APN calculation based on Australian Bureau of Statistics data: Census of Population and Housing, 2016 and 2021, General Community Profile, table G02 (selected medians and averages), 2016 State Suburbs and 2021 Suburbs and Localities, and table G01. Suburbs with unchanged boundaries, at least 5,000 residents at both Censuses, and a resident count that fell by no more than a fifth or rose by no more than a quarter. Current dollars.
In each of the ten the change in the median was below the rise in consumer prices, and in four the median fell. They include the centre of Darwin, three places in the Gladstone area of Queensland (Clinton, New Auckland and Tannum Sands), and three neighbouring suburbs in Sydney’s south-west (Greenfield Park, Wetherill Park and Bossley Park).
Where this sits in the index
Advancement Velocity (24134) combines two measures of change between Censuses for each locality: the change in household income and the change in the share of adults with a degree. This article reports the first on the ABS’s published medians.
What this does not show
The figures compare two Census nights five years apart. They are medians, so they say nothing about how incomes are spread within a suburb. They are in current dollars and before tax. They reflect who lived in each suburb on each night, so a change can come from people moving in or out as much as from incomes changing. The 2021 Census was taken on 10 August 2021, during lockdowns in several states, when some incomes were temporarily reduced and some were supported by government payments. Results from the August 2026 Census will add a third point.
- Australian Bureau of Statistics (Reference period: 2016) Census of Population and Housing: General Community Profile DataPack, State Suburbs, tables G01 and G02 [https://www.abs.gov.au/census/find-census-data/datapacks], ABS Website, accessed 11 October 2026.
- Australian Bureau of Statistics (Reference period: 2021) Australian Statistical Geography Standard (ASGS) Edition 3: Correspondences, 2016 State Suburbs to 2021 Suburbs and Localities [https://www.abs.gov.au/statistics/standards/australian-statistical-geography-standard-asgs/edition-3-july-2021-june-2026/access-and-downloads/correspondences], ABS Website, accessed 11 October 2026.
- Australian Bureau of Statistics (Reference period: 2021) Census of Population and Housing: General Community Profile, tables G01 and G02, by Suburbs and Localities [https://www.abs.gov.au/census/find-census-data/datapacks], ABS Website, accessed 11 October 2026.
- Australian Bureau of Statistics (Reference period: 2021) Census of Population and Housing: Time Series Profile, table T02, Australia, states and territories [https://www.abs.gov.au/census/find-census-data/datapacks], ABS Website, accessed 11 October 2026.
- Australian Bureau of Statistics (Reference period: September quarters 2016 and 2021) Consumer Price Index, Australia [https://www.abs.gov.au/statistics/economy/price-indexes-and-inflation/consumer-price-index-australia], ABS Website, accessed 11 October 2026.
ABS material is used under a Creative Commons Attribution 4.0 International licence. Calculations, standardisations and index readings are APN’s and are not attributable to the ABS.
Disclaimer
The analysis and information contained in this publication are for general informational and strategic purposes only and do not constitute financial, investment, legal, or any other form of professional advice. Australian Property Network is not a licensed financial advisor. Property values and market conditions can go up or down. Before making any property or investment decisions, you must conduct your own thorough research and seek independent professional advice tailored to your specific circumstances. Images are for illustrative purposes only. E.&O.E.
Findings are presented on the basis of data and evidence alone.
