
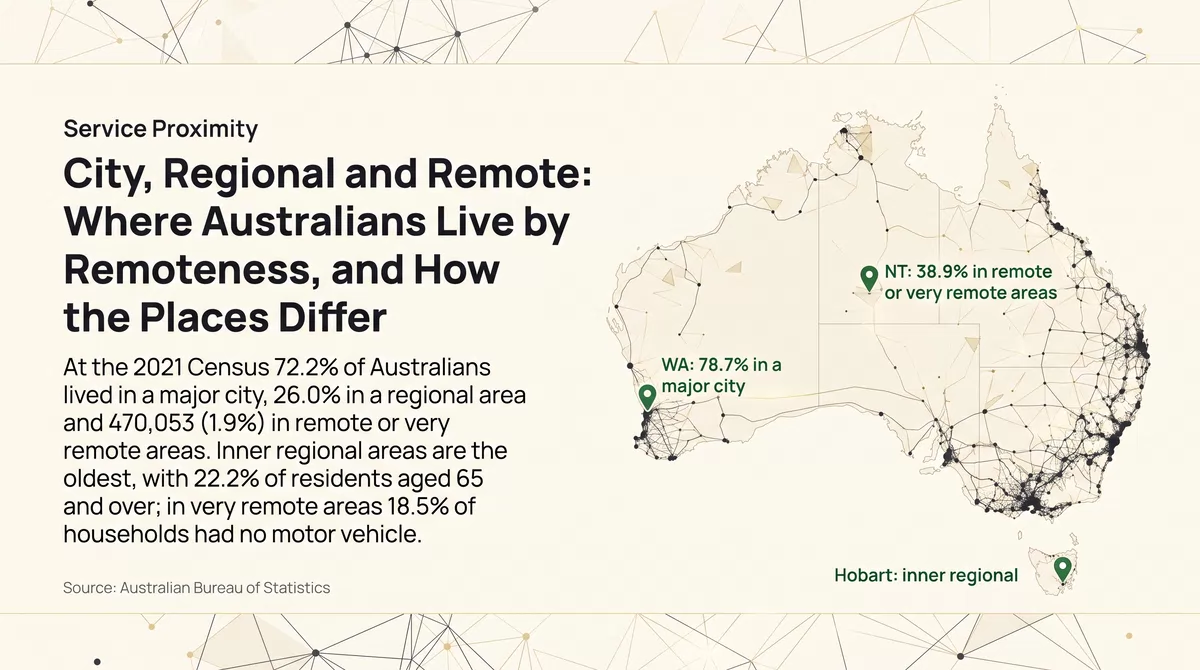

At the 2021 Census, 72.2% of Australians lived in a major city and 26.0% in a regional area. Remote and very remote Australia together were home to 470,053 people: 1.9% of the population. The five classes differ in more than distance. Inner regional areas are the oldest, with 22.2% of residents aged 65 and over, and very remote areas the youngest, at 10.5%. In very remote areas 18.5% of households had no motor vehicle and 21.6% of people who travelled to work walked.
Remoteness Areas are the ABS classification of every part of Australia by road distance to service centres. Figures are from the Census of 10 August 2021.
What is measured
The Australian Bureau of Statistics divides the country into five classes of remoteness: Major Cities of Australia, Inner Regional Australia, Outer Regional Australia, Remote Australia and Very Remote Australia. The classes rest on a measure of the road distance from each populated place to the nearest service centres of five sizes, with the population of a centre standing in for the services it is likely to offer. Remoteness is a measure of relative access by road. It does not say which services a place has, or whether they have capacity.
This article uses the 2021 Census counts published for each class. People are counted where they usually live. The 52,920 people with no usual address, or counted offshore or in transit, are left out.
Where people live
Residents by remoteness class, Australia, 2021
APN calculation based on Australian Bureau of Statistics data: Census of Population and Housing: General Community Profile, 2021, Table G01 (selected person characteristics) by Remoteness Area (Australian Statistical Geography Standard Edition 3). Usual residents with a usual address in one of the five remoteness classes. Share of residents, with the number in each class.
More than seven in ten Australians, 18.32 million people, lived in a major city. A further 4.54 million lived in inner regional areas and 2.05 million in outer regional areas. Remote Australia had 287,364 residents and very remote Australia 182,689.
State by state
| State or territory | Residents | Major Cities | Inner Regional | Outer Regional | Remote | Very Remote |
|---|---|---|---|---|---|---|
| New South Wales | 8,060,785 | 75.4% | 19.5% | 4.7% | 0.3% | 0.1% |
| Victoria | 6,494,367 | 77.3% | 18.7% | 4.0% | 0.1% | none |
| Queensland | 5,141,283 | 64.8% | 19.4% | 13.4% | 1.4% | 1.0% |
| South Australia | 1,778,126 | 75.6% | 9.9% | 11.3% | 2.5% | 0.8% |
| Western Australia | 2,651,452 | 78.7% | 8.7% | 6.9% | 3.3% | 2.3% |
| Tasmania | 556,179 | none | 62.1% | 35.9% | 1.5% | 0.5% |
| Northern Territory | 229,004 | none | none | 61.1% | 20.5% | 18.4% |
| Australian Capital Territory | 453,888 | 99.8% | 0.2% | none | none | none |
| Australia | 25,369,867 | 72.2% | 17.9% | 8.1% | 1.1% | 0.7% |
APN calculation based on Australian Bureau of Statistics data: Census of Population and Housing: General Community Profile, 2021, Table G01 (selected person characteristics) by Remoteness Area (Australian Statistical Geography Standard Edition 3). Usual residents with a usual address in one of the five remoteness classes. Share of each state or territory’s residents in each class, calculated before rounding. Australia includes the residents of the Other Territories.
The classification is national, so a state can have no area in a class. Tasmania and the Northern Territory have no major city on this measure: Hobart is classed as inner regional and Darwin as outer regional. Outside the Australian Capital Territory, Western Australia has the largest share of residents in major cities (78.7%) and Queensland the smallest among the mainland states (64.8%).
In the Northern Territory 38.9% of residents lived in remote or very remote areas, against 5.6% in Western Australia and 3.2% in South Australia. By number, Western Australia had the most remote and very remote residents (148,098), followed by Queensland (123,832) and the Northern Territory (89,102).
Who lives there
Share of residents aged 65 and over, by remoteness class, 2021
APN calculation based on Australian Bureau of Statistics data: Census of Population and Housing: General Community Profile, 2021, Table G01 (selected person characteristics) by Remoteness Area (Australian Statistical Geography Standard Edition 3). Share of residents aged 65 and over; the share aged under 15 is shown beside each bar.
Age does not rise steadily with distance. The oldest populations are in inner and outer regional areas, where 22.2% and 20.5% of residents were aged 65 and over, against 15.7% in major cities. Remote and very remote areas are younger than the cities: 10.5% of very remote residents were 65 and over, and 21.3% were under 15.
| Remoteness class | Residents | Aged 65 and over | Under 15 | Aboriginal and/or Torres Strait Islander | Born overseas |
|---|---|---|---|---|---|
| Major Cities | 18,315,045 | 15.7% | 18.3% | 1.8% | 34.9% |
| Inner Regional | 4,535,756 | 22.2% | 17.8% | 4.5% | 13.9% |
| Outer Regional | 2,049,013 | 20.5% | 18.0% | 7.3% | 15.0% |
| Remote | 287,364 | 14.8% | 20.4% | 15.3% | 15.0% |
| Very Remote | 182,689 | 10.5% | 21.3% | 40.6% | 11.2% |
APN calculation based on Australian Bureau of Statistics data: Census of Population and Housing: General Community Profile, 2021, Table G01 (selected person characteristics) by Remoteness Area (Australian Statistical Geography Standard Edition 3). Usual residents with a usual address in one of the five remoteness classes. The born overseas share leaves out people who did not state a birthplace.
Aboriginal and/or Torres Strait Islander people were 1.8% of residents in major cities and 40.6% in very remote areas. Most nonetheless lived in cities and regional areas: 41.4% of Aboriginal and/or Torres Strait Islander people counted in the five classes lived in a major city and 14.7% in remote or very remote areas. People born overseas were 34.9% of residents in major cities and between 11.2% and 15.0% in the other four classes.
Vehicles at home
Share of households with no motor vehicle, by remoteness class, 2021
APN calculation based on Australian Bureau of Statistics data: Census of Population and Housing: General Community Profile, 2021, Table G34 (number of motor vehicles by dwellings) by Remoteness Area (Australian Statistical Geography Standard Edition 3). Share of households with no motor vehicle, among occupied private dwellings that stated a number; the share with three or more is shown beside each bar.
Households in regional and remote areas keep more vehicles than those in the cities. The share with three or more was 17.5% in major cities and between 23.2% and 24.0% in inner regional, outer regional and remote areas. Very remote areas are the exception: 18.5% of households there had no motor vehicle, more than twice the share in major cities (8.2%). A companion article sets out how many motor vehicles households keep by state and suburb.
The trip to work
Share of people who travelled to work who walked, by remoteness class, Census day 2021
APN calculation based on Australian Bureau of Statistics data: Census of Population and Housing: General Community Profile, 2021, Table G62 (method of travel to work) by Remoteness Area (Australian Statistical Geography Standard Edition 3). Share of employed people who travelled to work on Tuesday 10 August 2021 who walked all the way; the share who went by car only, as driver or passenger, is shown beside each bar. Parts of the country were under stay-at-home orders that day.
| Remoteness class | Worked at home | Of those who travelled: car | Public transport | Walked only |
|---|---|---|---|---|
| Major Cities | 24.4% | 83.1% | 8.9% | 3.3% |
| Inner Regional | 12.3% | 90.3% | 1.5% | 3.9% |
| Outer Regional | 9.6% | 88.3% | 1.7% | 5.1% |
| Remote | 9.1% | 82.4% | 2.1% | 9.1% |
| Very Remote | 8.4% | 62.5% | 6.5% | 21.6% |
APN calculation based on Australian Bureau of Statistics data: Census of Population and Housing: General Community Profile, 2021, Table G62 (method of travel to work) by Remoteness Area (Australian Statistical Geography Standard Edition 3). Employed people aged 15 and over on Tuesday 10 August 2021, when parts of the country were under stay-at-home orders. Worked at home is a share of all employed people; the other columns are shares of those who travelled. Public transport is a train, bus, ferry or tram as the only method, or a train or bus combined with another method.
Walking to work rises with each step away from the cities, from 3.3% of travellers in major cities to 9.1% in remote areas and 21.6% in very remote areas. Working at home runs the other way, from 24.4% of employed people in major cities to 8.4% in very remote areas. The city figure reflects the stay-at-home orders in force in parts of New South Wales and Victoria on Census day; a companion article sets out how Australians got to work on Census day 2021.
What this does not show
Remoteness classes are broad. A regional city of 100,000 people and a town of 2,000 can fall in the same class, and conditions within a class differ widely between states. The classes describe road distance to centres of a given size, not the services actually present, their cost or their waiting times. The Census counts people where they usually live, so workers who fly in to a remote site and live elsewhere are counted at home. The travel figures describe one day in August 2021. Results from the August 2026 Census will show how these patterns have moved.
- Australian Bureau of Statistics (Reference period: 2021) Census of Population and Housing: General Community Profile, tables G01, G34 and G62, by Remoteness Area [https://www.abs.gov.au/census/find-census-data/datapacks], ABS Website, accessed 12 October 2026.
- Australian Bureau of Statistics (Reference period: July 2021 to June 2026) Australian Statistical Geography Standard (ASGS) Edition 3: Remoteness Areas [https://www.abs.gov.au/statistics/standards/australian-statistical-geography-standard-asgs-edition-3/jul2021-jun2026/remoteness-structure/remoteness-areas], ABS Website, accessed 12 October 2026.
ABS material is used under a Creative Commons Attribution 4.0 International licence. Calculations, standardisations and index readings are APN’s and are not attributable to the ABS.
Disclaimer
The analysis and information contained in this publication are for general informational and strategic purposes only and do not constitute financial, investment, legal, or any other form of professional advice. Australian Property Network is not a licensed financial advisor. Property values and market conditions can go up or down. Before making any property or investment decisions, you must conduct your own thorough research and seek independent professional advice tailored to your specific circumstances. Images are for illustrative purposes only. E.&O.E.
Findings are presented on the basis of data and evidence alone.
