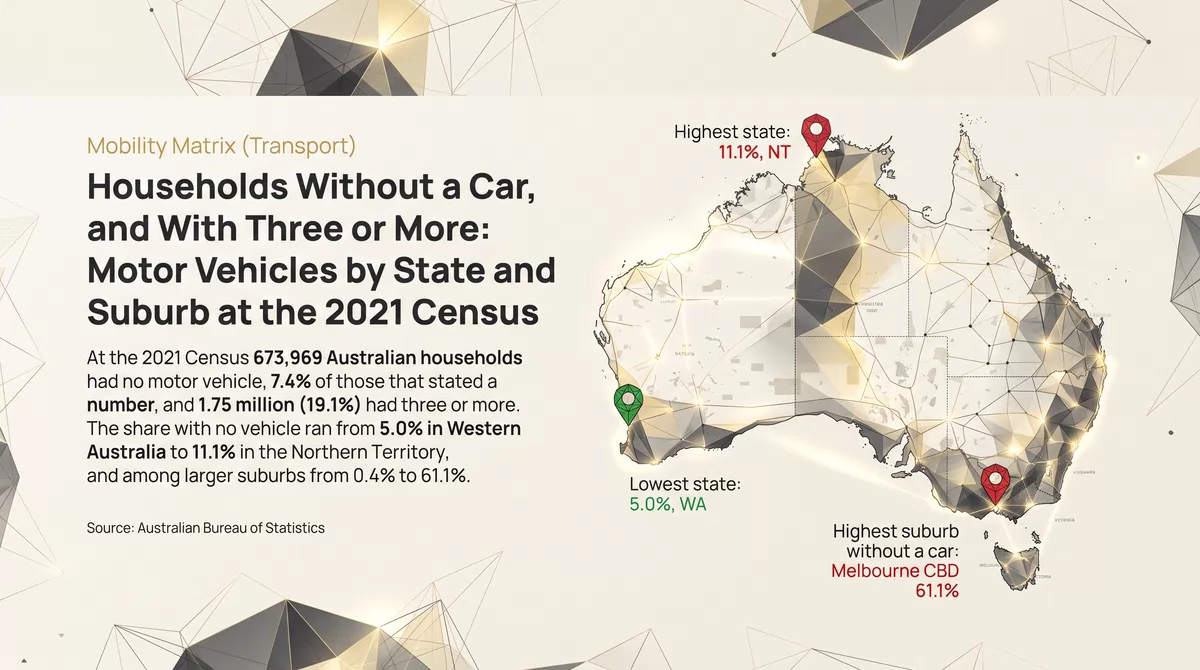

At the 2021 Census, 673,969 Australian households had no motor vehicle: 7.4% of those that stated a number. More than twice as many, 1.75 million or 19.1%, had three or more. The share with no vehicle rises with the size of the place, from 3.4% in localities of 201 to 999 residents to 9.2% in those of 20,000 or more, and among larger suburbs it ran from 0.4% to 61.1%.
The Census counts registered motor vehicles garaged or parked at or near each occupied private dwelling on Census night, 10 August 2021.
What is measured
The Census asks each household how many registered motor vehicles owned or used by its residents were garaged or parked at or near the dwelling on Census night. Vans and company vehicles kept at home are counted. Motorbikes, scooters and heavy vehicles are not. Table G34 of the Census General Community Profile gives the number of occupied private dwellings with none, one, two, three, and four or more. In this article a household means an occupied private dwelling, and shares leave out the 1.5% of dwellings that did not state a number.
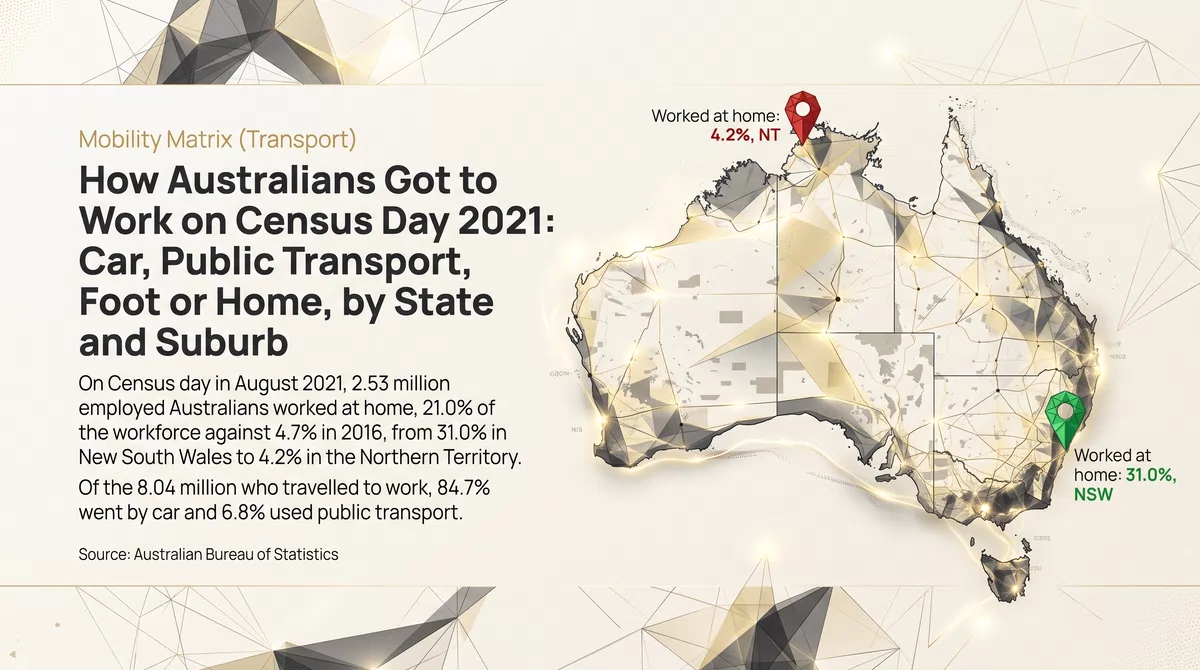
The count is of vehicles kept at home, not of how they were used. A companion article sets out how Australians got to work on Census day 2021, a day on which parts of the country were under stay-at-home orders. The number of vehicles a household keeps does not change from one day to the next in the way travel does.
The national picture
Households by number of motor vehicles, Australia, 2021
APN calculation based on Australian Bureau of Statistics data: Census of Population and Housing: General Community Profile, 2021, Table G34 (number of motor vehicles by dwellings). Occupied private dwellings by the number of registered motor vehicles owned or used by residents and garaged or parked at or near the dwelling on Census night, as a share of dwellings that stated a number. The number of dwellings is shown beside each bar. Motorbikes, scooters and heavy vehicles are not counted.
One vehicle and two vehicles are almost equally common: 36.7% and 36.8% of households. A further 12.2% had three and 6.9% had four or more. Households with no vehicle numbered 673,969.
The 2016 Census counted 623,829 households with no vehicle and 1.50 million with three or more. On the same basis, the share with none eased from 7.8% to 7.4% over the five years and the share with three or more rose from 18.7% to 19.1%. The number of households grew 11.9% over the five years, and more of them answered the question: 1.5% did not state a number in 2021, against 3.4% in 2016.
By state and territory
Share of households with no motor vehicle, by state and territory, 2021
APN calculation based on Australian Bureau of Statistics data: Census of Population and Housing: General Community Profile, 2021, Table G34 (number of motor vehicles by dwellings). Share of households with no motor vehicle; the share with three or more is shown beside each bar. Occupied private dwellings by the number of registered motor vehicles owned or used by residents and garaged or parked at or near the dwelling on Census night, as a share of dwellings that stated a number.
The share of households with no vehicle was highest in the Northern Territory (11.1%) and New South Wales (9.2%) and lowest in Western Australia (5.0%). Three or more vehicles were most common in Tasmania (22.8%) and Western Australia (21.0%) and least common in the Australian Capital Territory (16.5%).
By size of place
Share of households with no motor vehicle, by the size of the locality
APN calculation based on Australian Bureau of Statistics data: Census of Population and Housing: General Community Profile, 2021, Tables G01 (selected person characteristics) and G34 (number of motor vehicles by dwellings). Share of households with no motor vehicle; the share with three or more is shown beside each bar. Localities are ABS Suburbs and Localities, grouped by their number of residents.
The smaller the place, the more vehicles a household keeps. In localities of 201 to 999 residents, 3.4% of households had no vehicle and 30.5% had three or more. In the 143 localities of 20,000 or more, 9.2% had none and 16.5% had three or more. Localities with 200 or fewer residents, which are not reported individually, had 1.4% with none and 36.3% with three or more, taken together.
How larger suburbs are spread
Number of larger localities by the share of households with no motor vehicle
APN calculation based on Australian Bureau of Statistics data: Census of Population and Housing: General Community Profile, 2021, Tables G01 (selected person characteristics) and G34 (number of motor vehicles by dwellings). The 1,561 localities with at least 5,000 residents, by the share of households with no motor vehicle.
Across the 1,561 localities with at least 5,000 residents, the middle locality had 5.9% of households with no vehicle and 18.0% with three or more. Households without a vehicle are concentrated: the 62 localities where at least one household in five had none hold 4.1% of the country’s households and 18.3% of its households with no vehicle.
Where the most households have no vehicle
| Locality | State | Households | No motor vehicle | One | Three or more |
|---|---|---|---|---|---|
| Melbourne | Vic. | 26,941 | 61.1% | 33.1% | 0.8% |
| Haymarket | NSW | 2,886 | 61.0% | 34.2% | 0.8% |
| Sydney | NSW | 6,897 | 60.3% | 33.6% | 0.8% |
| Chippendale | NSW | 3,670 | 59.8% | 34.1% | 1.1% |
| Potts Point | NSW | 3,875 | 56.7% | 36.1% | 1.3% |
| Carlton | Vic. | 6,778 | 48.6% | 40.0% | 2.2% |
| Ultimo | NSW | 2,727 | 48.2% | 42.8% | 1.1% |
| Surry Hills | NSW | 7,652 | 48.2% | 42.3% | 1.5% |
| Darlinghurst | NSW | 5,308 | 45.8% | 44.1% | 1.7% |
| Brisbane City | Qld | 5,480 | 41.1% | 47.4% | 1.4% |
APN calculation based on Australian Bureau of Statistics data: Census of Population and Housing: General Community Profile, 2021, Tables G01 (selected person characteristics) and G34 (number of motor vehicles by dwellings). Localities with at least 5,000 residents. Shares of households that stated a number of vehicles. Counts are as published by the ABS, which makes small random adjustments to protect confidentiality.
The ten highest are the centres of Melbourne, Sydney and Brisbane and the suburbs beside them. In five of them more than half of households had no vehicle, and in none of the ten did more than 2.2% of households have three or more.
Where the most households have three or more
| Locality | State | Households | No motor vehicle | One | Three or more |
|---|---|---|---|---|---|
| Narre Warren North | Vic. | 2,203 | 0.7% | 10.1% | 52.4% |
| Kenthurst | NSW | 1,540 | 1.2% | 11.5% | 51.9% |
| New Beith | Qld | 1,569 | 0.5% | 7.8% | 49.2% |
| Jimboomba | Qld | 2,177 | 0.9% | 17.4% | 44.4% |
| Greenbank | Qld | 2,854 | 0.8% | 16.7% | 44.2% |
| Cecil Hills | NSW | 1,844 | 2.4% | 20.2% | 42.4% |
| Logan Village | Qld | 1,668 | 1.5% | 20.3% | 42.3% |
| Lysterfield | Vic. | 2,044 | 0.9% | 15.0% | 41.7% |
| West Hoxton | NSW | 2,608 | 1.8% | 17.7% | 40.7% |
| Worongary | Qld | 1,830 | 1.3% | 16.0% | 39.8% |
APN calculation based on Australian Bureau of Statistics data: Census of Population and Housing: General Community Profile, 2021, Tables G01 (selected person characteristics) and G34 (number of motor vehicles by dwellings). Localities with at least 5,000 residents. Shares of households that stated a number of vehicles. Counts are as published by the ABS, which makes small random adjustments to protect confidentiality.
The ten highest are on the outer edges of Melbourne, Sydney, Brisbane and the Gold Coast, five of them in Queensland. In two of them more than half of households had three or more vehicles.
Vehicles at home and the trip to work
Public transport share of the trip to work on Census day, by the share of households with no motor vehicle
APN calculation based on Australian Bureau of Statistics data: Census of Population and Housing: General Community Profile, 2021, Tables G01, G34 and G62 (method of travel to work). The 1,561 localities with at least 5,000 residents, grouped by the share of households with no motor vehicle. Each bar is the middle locality’s share of people who travelled to work on Tuesday 10 August 2021 who used public transport; the middle locality’s share who went by car alone is shown beside it. Parts of the country were under stay-at-home orders that day.
The two Census questions line up closely. Across larger localities, the share of households with no vehicle and the car share of the trip to work have a correlation of −0.82; with the public transport share it is 0.67. Where fewer than 2% of households had no vehicle, the middle locality had 90.8% of its travelling workers go by car. Where 30% or more had none, it was 35.2%, and 27.9% used public transport.
What this does not show
The Census does not ask why a household has no vehicle. Some households choose not to keep one and others cannot afford one or cannot drive, and the count does not separate them. It counts households, not people: a household of one and a household of six each count once. The table groups every answer of four or more together, so the total number of vehicles cannot be worked out from it. Company vehicles kept at home are counted, and motorbikes are not. The comparison with the trip to work describes localities, not households: it does not show that the households without a vehicle are the ones using public transport. Results from the August 2026 Census will update these figures.
- Australian Bureau of Statistics (Reference period: 2016) 2016 Census All persons QuickStats: Australia [https://www.abs.gov.au/census/find-census-data/quickstats/2016/0], ABS Website, accessed 12 October 2026.
- Australian Bureau of Statistics (Reference period: 2021) Census of Population and Housing: Census dictionary, Number of motor vehicles (VEHD) [https://www.abs.gov.au/census/guide-census-data/census-dictionary/2021/variables-topic/transport/number-motor-vehicles-vehd], ABS Website, accessed 12 October 2026.
- Australian Bureau of Statistics (Reference period: 2021) Census of Population and Housing: General Community Profile, tables G01, G34 and G62, by Suburbs and Localities, state and Australia [https://www.abs.gov.au/census/find-census-data/datapacks], ABS Website, accessed 12 October 2026.
ABS material is used under a Creative Commons Attribution 4.0 International licence. Calculations, standardisations and index readings are APN’s and are not attributable to the ABS.
Disclaimer
The analysis and information contained in this publication are for general informational and strategic purposes only and do not constitute financial, investment, legal, or any other form of professional advice. Australian Property Network is not a licensed financial advisor. Property values and market conditions can go up or down. Before making any property or investment decisions, you must conduct your own thorough research and seek independent professional advice tailored to your specific circumstances. Images are for illustrative purposes only. E.&O.E.
Findings are presented on the basis of data and evidence alone.