
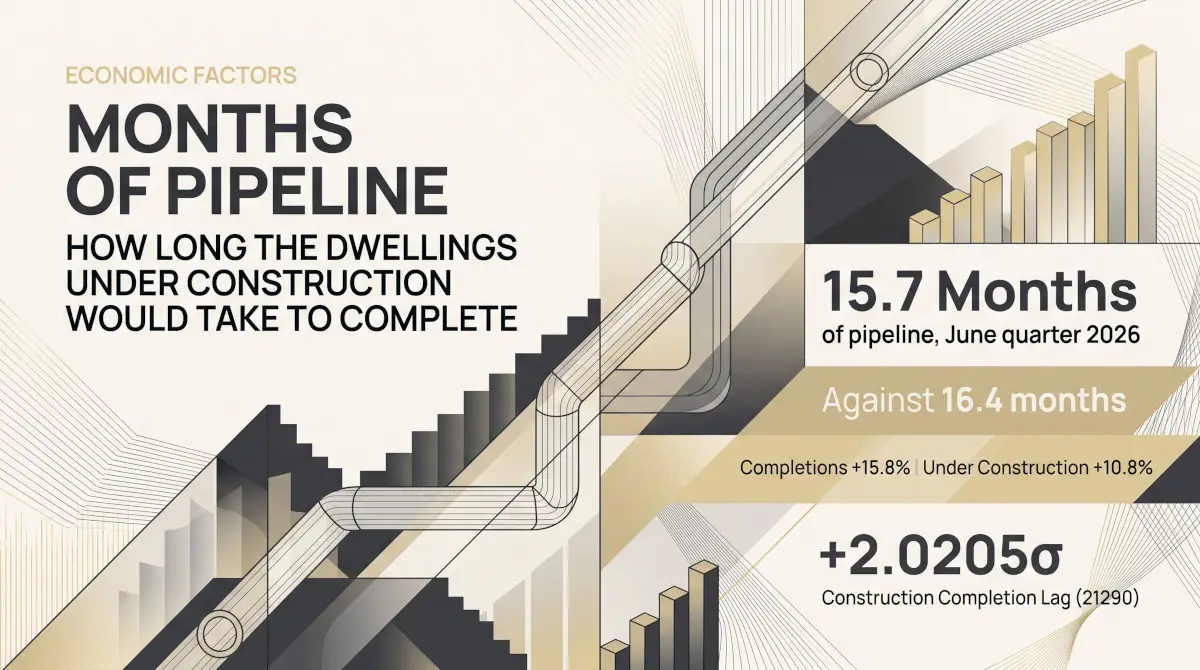

At the June quarter 2026 pace of completions, the 248,733 dwellings under construction in Australia would take 15.7 months to complete. That is fewer months than a year earlier, 16.4, even though the number under construction rose 10.8%: completions in the quarter rose faster, by 15.8%. The measure has been more than one and a half standard deviations above its usual level for the time of year in every quarter since September 2021. For June quarters it averaged 9.3 months from 1985 to 2025, and has exceeded 13 months in every June quarter since 2021. Construction Completion Lag (21290) compares each quarter with the usual level for that time of year.
Months of pipeline divide the dwellings under construction by the quarter’s completions, so they rise when the stock grows faster than completions.
What the measure is
Months of pipeline divide the number of dwellings under construction at the end of a quarter by the number completed during it, and multiply by three to express the result in months. It answers a simple question: if builders kept completing dwellings at the latest quarter’s pace and started nothing new, how long would the work already under way take to finish? Both figures come from the ABS Building Activity survey and count dwelling units across all sectors.
It is not the time any particular dwelling takes to build. A house may take months and a large apartment building years; the measure averages across everything under way. In every year since 2011, completions have been lowest in the March quarter, and the March quarter has read highest. The fair comparison is with the same quarter in other years.
Since 2011
Months of pipeline, Australia, March quarter 2011 to June quarter 2026
APN calculation based on Australian Bureau of Statistics data: Building Activity, Australia, June quarter 2026, Tables 37 and 76 (A83801977V, A83801978W). Dwellings under construction at the end of the quarter divided by dwellings completed in the quarter, times three. Original, all sectors.
From 2011 to 2020, outside March quarters, the measure moved between 9.7 and 12.7 months; March quarters read between 10.8 and 17.0. It rose through 2021, as commencements rose about a quarter in the year while completions were flat, and has stayed higher since. In the March quarter 2026 it read 18.9 months, the seasonal high, and in the June quarter 15.7.
June quarters compared
Months of pipeline in the June quarter, 2011 to 2026
APN calculation based on Australian Bureau of Statistics data: Building Activity, Australia, June quarter 2026, Tables 37 and 76 (A83801977V, A83801978W). Dwellings under construction at the end of the quarter divided by dwellings completed in the quarter, times three. Original, all sectors. The dotted line is the average for June quarters, 1985 to 2025.
| June quarter 2025 | June quarter 2026 | Change | |
|---|---|---|---|
| Dwellings under construction (end of quarter) | 224,571 | 248,733 | +10.8% |
| Dwellings completed in the quarter | 41,153 | 47,654 | +15.8% |
| Months of pipeline | 16.37 | 15.66 | −0.71 |
APN calculation based on Australian Bureau of Statistics data: Building Activity, Australia, June quarter 2026, Tables 37, 38 and 76 (A83801977V, A83801978W). Original, all sectors. Completions in the table are the sum of the states (Table 38).
From 2011 to 2020 every June quarter read between 9.7 and 12.1 months; every June quarter since 2021 has read above 13. The highest was June 2023, 16.8 months, followed by June 2022 (16.6) and June 2025 (16.4); June 2026 is fourth. Between June 2025 and June 2026 the stock under construction grew by 24,162 dwellings, but completions in the June quarter rose from 41,153 to 47,654, so the months it would take to clear fell. How the stock came to be the largest since the ABS series began in 1984 is set out in From Approval to Completion: Australia’s Dwelling Pipeline Stage by Stage.
Against the usual level for the quarter
Construction Completion Lag (21290): months of pipeline against the usual level for each quarter, 2011 to 2026
Construction Completion Lag (21290). APN calculation based on Australian Bureau of Statistics data. Months of pipeline in each quarter, less the average for that quarter of the year (1984 to 2025), in standard deviations.
Construction Completion Lag (21290) removes the seasonal pattern by comparing each quarter with the average for that quarter of the year since 1984, scaled by how much that quarter usually varies. On that basis the March and June quarters of 2026 sit at the same distance above normal, about two standard deviations, so the fall from March to June matches the seasonal pattern once each quarter’s usual range is allowed for; the measure’s position relative to normal did not change. The highest reading since 2011 was the June quarter 2023. Ranked against 84 quarters, the June quarter 2026 reading has a position of 90.4.
What this does not show
The measure is a ratio of a stock to one quarter’s flow, so a single strong or weak quarter of completions moves it, and it assumes nothing new starts. A rising figure can mean projects are taking longer, or simply that more work has started than is finishing; this ratio does not separate the two. The ABS publishes average dwelling completion times separately, in the June quarter edition of Building Activity. It counts dwellings, not their size or cost, and mixes houses with apartments, which take much longer to build. The figures are original estimates and the ABS revises recent quarters as late returns arrive. The measure says nothing about why completions run at the pace they do.
- Australian Bureau of Statistics (Reference period: June quarter 2026) Building Activity, Australia [https://www.abs.gov.au/statistics/industry/building-and-construction/building-activity-australia/jun-2026], ABS Website, accessed 7 October 2026.
ABS material is used under a Creative Commons Attribution 4.0 International licence. Calculations, standardisations and index readings are APN’s and are not attributable to the ABS.
Findings are presented on the basis of data and evidence alone.


