
The SPCI (24800) Structural Incongruity: How Systemic Execution Deficits are Constraining Australia’s Infrastructure-Led Development
APN ANALYSIS: A-251115-AUS130473
Executive Summary
State and Federal governments are deploying capital into public infrastructure, with a national pipeline exceeding $213 billion, headlined by New South Wales’ $118.3 billion commitment. This recorded investment, intended to catalyse economic growth and unlock housing supply, is being structurally compromised by sustained execution deficiency. The ‘SPCI (24800) structural incongruity’ is now manifest: a simultaneous commitment to maximum capital expenditure alongside elevated rates of project cost overruns and delays, exemplified by an average 37% cost overrun on major rail projects. This sustained capital inefficiency functions as a direct mechanism for value erosion, suppressing the intended Infrastructure Uplift Multiplier (IUM) and consuming the economic surplus required to justify the investment.
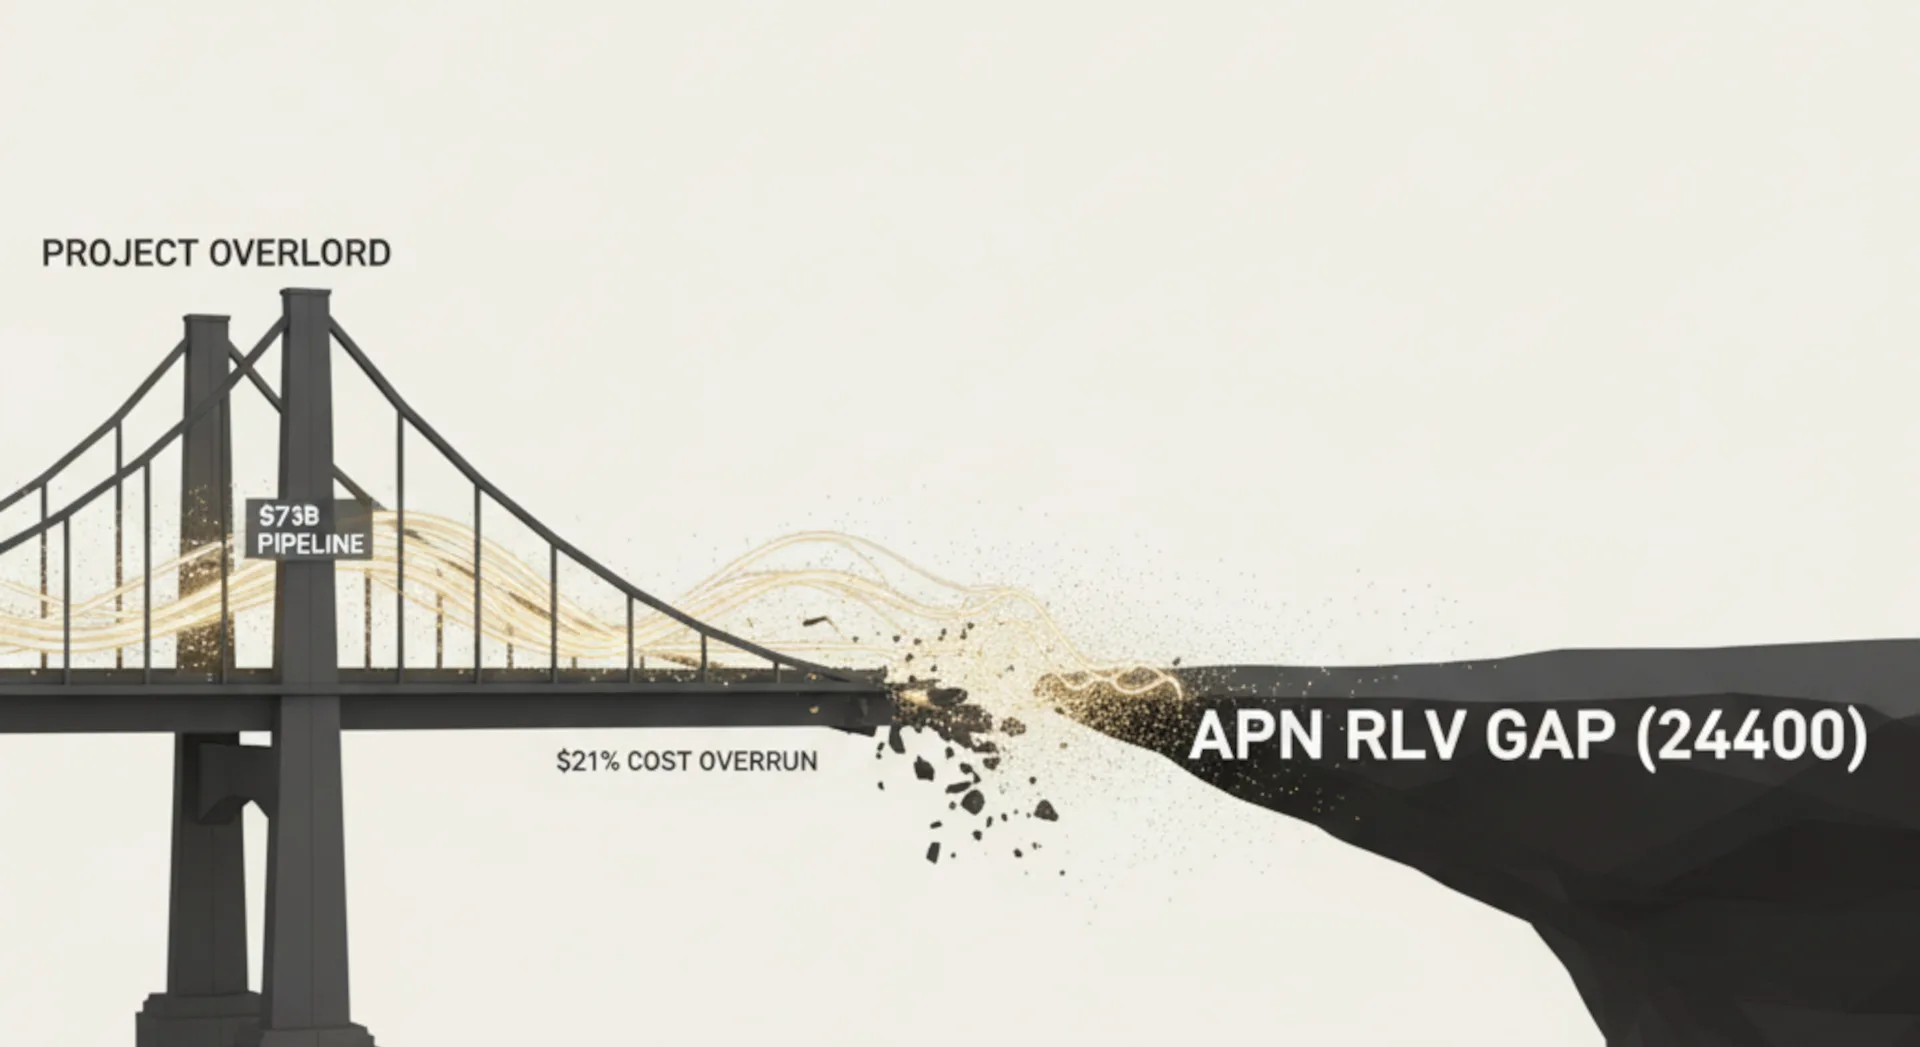
For property professionals, this systemic deficiency is not a background risk; it is a core commercial reality. The persistent delays and cost blowouts directly compromise development feasibility by extending the closure period of the Residual Land Value (RLV) Gap. Government schedule slippage translates directly into higher holding costs, reduced profit margins, and commercially non-viable projects for the private sector. This environment demands a substantive recalibration of investment models to price in governmental execution risk as a baseline cost, not a remote contingency.
Background & Strategic Context
This analysis validates the core APN thesis of the APN Sovereign Policy Composite Index™ (SPCI, 24800), demonstrating how state-led capital deployment, when coupled with material institutional deficiency, becomes a primary driver of market friction and value erosion. The current environment exposes an elevated disconnect between government ambition and its organisational capability to execute, a dynamic that directly impacts the forward-looking metrics of APN’s proprietary indices. The state is now simultaneously the market’s greatest catalyst and its most significant source of risk.
The Primacy of State Action (SPCI, 24800): The structural incongruity of maximum capital commitment and elevated execution underperformance is a defining feature of the current market. The analysis confirms that state actors, through project announcements aligned with political cycles and deficient procurement governance, are embedding financial underperformance into the infrastructure pipeline from its inception, directly shaping the risk landscape for all property asset classes.
Supply-Side Friction (APN Future Development Pipeline Index™): The systemic delays and cost overruns directly compromise the two core mechanisms for unlocking supply. The intended Infrastructure Uplift Multiplier (IUM) is materially suppressed by cost blowouts, while sustained schedule slippage materially delays the final value realisation event required to close the Residual Land Value (RLV) Gap, turning viable precincts into dormant land banks.
Quantifying Institutional Drag (APN Risk & Compliance Index™ (24200)): The sustained deficiencies are a quantifiable function of high Regulatory Velocity Multiplier (RVM) friction. The combination of political optimism bias, administrative friction in approvals, and deficient procurement governance creates a systemic constraint on the capacity to deliver projects on time and on budget, eroding value at an institutional level.
Deconstruction of the Source Event
This deconstruction is based on APN’s analysis of the 2025-26 State and Federal budgets, alongside multiple reports from Infrastructure Australia and state audit offices. The key facts are:
- Recorded Capital Commitment: Governments have committed to a major public infrastructure pipeline valued at $213 billion over five years, with the NSW Government alone allocating $118.3 billion over four years to essential infrastructure.
- Systemic Cost Overruns: Major infrastructure projects consistently experience average cost increases between 10% and 39%. The rail sector exhibits the highest volatility, with a 37% average cost overrun from announcement to final delivery.
- Sustained Schedule Slippage: An estimated 86% of major transport projects exhibit either cost increases or delays. These delays typically range from 7% to 33% compared to original plans, with recent rail procurement projects facing delays of three to five years.
- Political Causation: Analysis from the Grattan Institute indicates that premature political announcements, made before rigorous evaluation, account for 74% of the total value of cost overruns in transport infrastructure over the past fifteen years.
- Quantifiable Value Erosion: A 37% cost overrun on a project with an initial Benefit-Cost Ratio of 1.5 reduces the Net Public Value by 74%, rendering a once-efficient project marginally justifiable and consuming nearly all anticipated public surplus.
Critical Analysis & Balanced View
The central structural incongruity is that the government’s primary instrument for economic stimulus and unlocking housing supply—infrastructure spending—has become a mechanism with counteracting effects. The scale of the investment pipeline is exceeding both the market’s delivery capacity and the public sector’s governance capability, creating a self-reinforcing inflationary condition where more spending yields diminishing returns. The issue is not a lack of capital, but a material institutional capability gap.
This is a structural outcome. The analysis confirms that political cycles incentivise optimistic, premature announcements over rigorous, deliverable plans. This ‘optimism bias’ is not an error but a structural feature of the political system, embedding financial underperformance into projects from their inception. The result is a structural pressure point in market confidence that extends to the private sector. As government entities exhibit deficiencies in managing complex risks and procurement processes exhibit sustained friction, contractors will either refuse to bid on major projects or price in materially elevated risk premiums, further exacerbating cost pressures.
However, this systemic deficiency creates a distinct opportunity for risk-informed capital. While the broader market is adversely affected by delays, investors with longer-term capital horizons can strategically position for the resulting distortion in land values. The government’s constrained capacity to deliver on time depresses asset values in affected precincts below their assessed long-term potential, creating acquisition opportunities for those who can accurately price in the delay and afford the extended carrying costs.
Strategic Implications for Property Professionals
- For Developers & Land Bankers: You must treat government timelines and budgets as aspirational, not factual. All feasibility models must now incorporate a baseline assumption of a 30-40% cost overrun and a 3-5 year delay for major enabling transport infrastructure. This directly impacts holding cost calculations and the required entry price to close the Residual Land Value (RLV) Gap.
- For Capital Allocators & Fund Managers: Investment strategy must pivot from ‘timing the announcement’ to ‘timing the revised completion’. Prioritise assets linked to projects already deep in the construction phase to de-risk from early-stage political and planning volatility. The greatest risk, and lowest risk-adjusted return, lies in projects still in the announcement and early planning stages, which are subject to political cycle influence.
- For Valuers & Financiers: The Infrastructure Uplift Multiplier (IUM) is not a guaranteed event but a time-sensitive variable. Valuations must be materially discounted for time, reflecting the high probability of multi-year delays. The Net Present Value of future uplift is being materially eroded by government execution deficiency, increasing the risk profile of loans secured against future development potential.
- For Agents & Buyers’ Agents: Use this analysis to manage client expectations and identify long-term opportunity. The ‘metro effect’ on property values is observable, but the timeline for its full realisation is subject to material variance from official schedules. Counsel clients that the price premium for infrastructure proximity will materialise, but the final uplift event is likely years beyond official government schedules, creating opportunities for buyers with long-term horizons.
APN Index Management
The APN Codex 24000 Series is a proprietary set of indices that translates complex market forces into measurable metrics. This section outlines how the preceding analysis is validated against, and informs the calibration of, these frameworks.
- Validation: This analysis provides primary validation for the APN Sovereign Policy Composite Index™ (SPCI, 24800) thesis, confirming that state-led action is a dominant source of both market opportunity (via capital injection) and systemic risk (via execution deficiency). It reinforces the direct link between state capability and market outcomes.
- Index Calibration: The APN Future Development Pipeline Index™ (24400) is calibrated to increase the friction coefficient applied to all major public transport projects in the pre-construction phase. The model will now automatically apply a baseline 37% cost and 3-year schedule overrun variable when calculating RLV Gap closure timelines for affected development precincts.
- Data Capture: This triggers a new data capture mandate to track the variance between announced, contracted, and final-cost/completion dates for all projects within the $213 billion national pipeline. This data will refine the Regulatory Velocity Multiplier friction metric within the APN Risk & Compliance Index™ (24200) risk framework.
Disclaimer
The analysis and information contained in this deconstruction are for general informational and strategic purposes only and do not constitute financial, investment, legal, or any other form of professional advice. The Australian Property Network (APN) is a strategic intelligence organisation and is not a licensed financial advisor.
This analysis is based on data and information from third-party sources believed to be reliable; however, APN provides no warranty as to its accuracy, currency, or completeness. Images used in this analysis are for illustrative and conceptual purposes only and may not represent real persons, properties, or events.
All frameworks (Codex 24100-24800) are proprietary to APN.
Property values and market conditions can go up or down. Before making any property or investment decisions, you must conduct your own thorough research and seek independent professional advice tailored to your specific circumstances.