
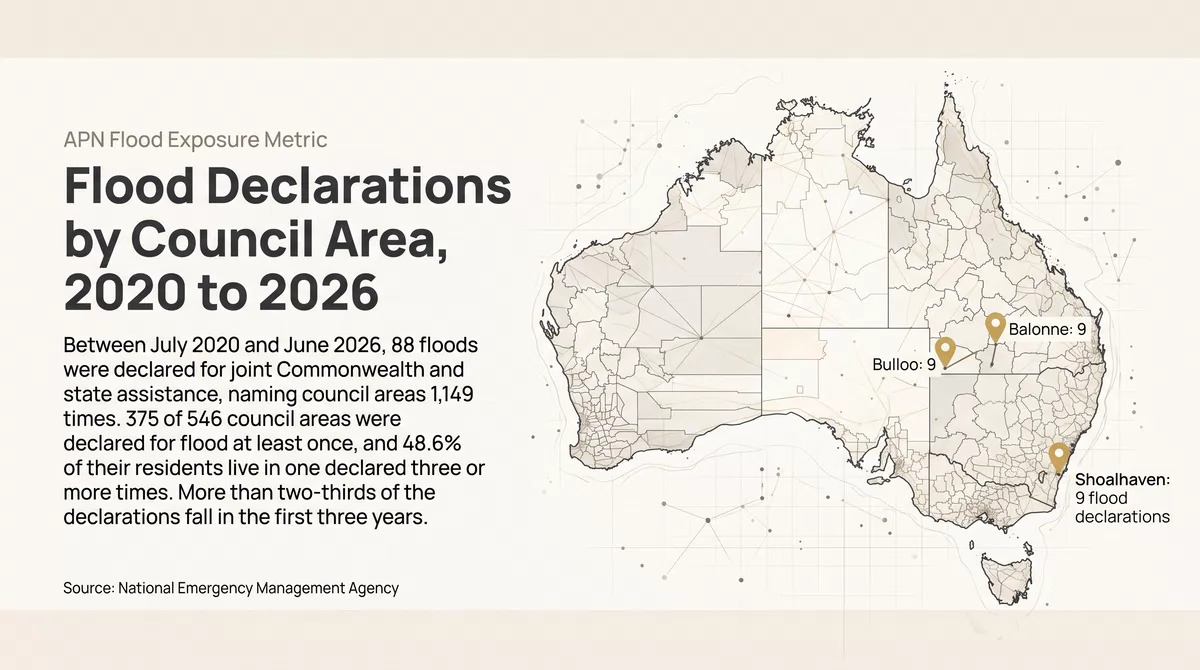

Between July 2020 and June 2026, 88 floods were declared for joint Commonwealth and state assistance, and council areas were named in them 1,149 times. 375 of the country’s 546 council areas were declared for flood at least once, and 48.6% of their residents live in one declared three or more times. More than two-thirds of the declarations fall in the first three of the six years, and New South Wales went from 399 declarations in those three years to 5 in the last two.
A declaration is an administrative act that opens government assistance. It is not a measure of flood depth, damage or risk.
What is measured
The Disaster Recovery Funding Arrangements are a cost-sharing arrangement between the Commonwealth and the states and territories, under which assistance is opened after a natural disaster. Each activation names the council areas it covers, and the National Emergency Management Agency publishes the list with the hazard it assigns to each event.
This article counts the events the agency lists as floods, for events that started between 1 July 2020 and 30 June 2026. An event is one activation. A flood declaration is one council area named in one flood event. The label is the agency’s. Events it lists as cyclones are left out, though a cyclone can bring flooding, and four events it lists as floods are named for a cyclone or former cyclone: they account for 93 of the 1,149 declarations, and one of them, a Queensland monsoon trough with two cyclones from December 2025, for 65 of Queensland’s 66 flood declarations in 2025–26. The agency’s listing gives the dataset a reference period starting in 2006, but the file dated 11 August 2026 holds few events before July 2020, so earlier years cannot be counted from it. A declaration covers a whole council area whatever share of it was flooded, and it shows that assistance was opened, not how deep the water was or how much damage was done. Companion articles cover every declared disaster by council area and bushfire declarations over the same period.
Year by year
Council-area flood declarations by year, July 2020 to June 2026
APN calculation based on National Emergency Management Agency data: DRFA Activation History by LGA, flood events starting 1 July 2020 to 30 June 2026, file of 11 August 2026. Flood declarations by the financial year in which the event started, with the number of separate flood events beside each bar. A flood declaration is one council area named in one event that the agency lists as a flood and that was activated under the Disaster Recovery Funding Arrangements. Events listed as a cyclone are not counted here, including those that brought flooding.
The year to June 2022 had 357 flood declarations across 22 events, the most of the six years. The first three years together account for 785 of the 1,149 declarations, 68% of the total. The last three years averaged 121 a year.
| Year to June | NSW | Vic. | Qld | SA | WA | Tas. | NT | All |
|---|---|---|---|---|---|---|---|---|
| 2020–21 | 96 | 41 | 22 | 0 | 3 | 0 | 4 | 166 |
| 2021–22 | 199 | 14 | 108 | 15 | 12 | 3 | 6 | 357 |
| 2022–23 | 104 | 66 | 52 | 9 | 2 | 20 | 9 | 262 |
| 2023–24 | 54 | 12 | 19 | 0 | 11 | 1 | 8 | 105 |
| 2024–25 | 5 | 0 | 109 | 1 | 0 | 29 | 2 | 146 |
| 2025–26 | 0 | 14 | 66 | 11 | 4 | 0 | 18 | 113 |
| Six years | 458 | 147 | 376 | 36 | 32 | 53 | 47 | 1,149 |
| Flood events | 20 | 12 | 24 | 4 | 12 | 5 | 11 | 88 |
APN calculation based on National Emergency Management Agency data: DRFA Activation History by LGA, flood events starting 1 July 2020 to 30 June 2026, file of 11 August 2026. Flood declarations by state and by the financial year in which the event started. The last row counts separate events; the Australian Capital Territory had none. A flood declaration is one council area named in one event that the agency lists as a flood and that was activated under the Disaster Recovery Funding Arrangements. Events listed as a cyclone are not counted here, including those that brought flooding.
The change is largely in New South Wales. Its council areas were declared for flood 399 times in the three years to June 2023, 54 times in the year to June 2024, 5 times in the year after and not at all in the year to June 2026. Queensland runs the other way: its highest year was 2024–25, with 109 declarations.
When floods start
Flood events by the month in which they started
APN calculation based on National Emergency Management Agency data: DRFA Activation History by LGA, flood events starting 1 July 2020 to 30 June 2026, file of 11 August 2026. The 88 flood events by the month in which each started, shown from July to June.
43 of the 88 flood events began between December and March. January has the most, with 13. No month of the year is without one.
A few large events
The average flood event named 13.1 council areas, but the size varies widely. The five largest events account for 30% of all flood declarations, and 49 of the 88 events named five council areas or fewer.
How often council areas are declared for flood
Council areas by number of flood declarations, July 2020 to June 2026
APN calculation based on National Emergency Management Agency data: DRFA Activation History by LGA, flood events starting 1 July 2020 to 30 June 2026, file of 11 August 2026. The 546 council areas with a population estimate, by number of flood declarations, with the share of their residents beside each bar. Residents are the ABS estimated resident population at 30 June 2025 (Regional Population, 2024–25).
171 council areas were not declared for flood in the six years; they hold 20.9% of residents. 81 council areas were declared five or more times, and they hold 15.2% of residents.
State by state
Share of residents in a council area declared for flood three or more times, by state
APN calculation based on National Emergency Management Agency data: DRFA Activation History by LGA, flood events starting 1 July 2020 to 30 June 2026, file of 11 August 2026. Share of each state’s residents living in a council area declared for flood three or more times; the share living in a council area never declared for flood is shown beside each bar. Residents are the ABS estimated resident population at 30 June 2025 (Regional Population, 2024–25).
In Queensland every council area was declared for flood at least once, and 96.7% of residents live in one declared three or more times. In New South Wales the share is 78.2%. In Western Australia and South Australia most residents live in a council area never declared for flood in the period: 95.9% and 90.0%.
These differences reflect where it flooded in six years and also how each state uses the arrangements. States decide when to seek activation and how to divide a wet season into events, so the counts are not a like-for-like measure of flood hazard between states.
The council areas declared for flood most often
| Council area | State | Flood declarations | Residents, June 2025 |
|---|---|---|---|
| Shoalhaven | NSW | 9 | 111,755 |
| Balonne | Qld | 9 | 4,350 |
| Bulloo | Qld | 9 | 347 |
| Eurobodalla | NSW | 8 | 41,309 |
| Diamantina | Qld | 8 | 265 |
| North Burnett | Qld | 8 | 10,562 |
| Quilpie | Qld | 8 | 720 |
APN calculation based on National Emergency Management Agency data: DRFA Activation History by LGA, flood events starting 1 July 2020 to 30 June 2026, file of 11 August 2026. Council areas declared for flood eight or more times. Residents are the ABS estimated resident population at 30 June 2025 (Regional Population, 2024–25).
Seven council areas were declared for flood eight or more times, and a further 12 seven times. The seven are of two kinds: coastal council areas in southern New South Wales, and large, sparsely settled shires in inland Queensland, several with fewer than a thousand residents.
What this does not show
A flood declaration says nothing about any particular property. It covers a whole council area, so a declaration can follow flooding along one river in a large shire. It is not a flood map and not a forecast: an area with no declaration in six years can flood, and an area declared many times contains streets that have never been under water. The count leaves out floods that were not declared and flooding recorded under a cyclone. Six years is a short period, and most of the declarations fall in its first three years.
- Australian Bureau of Statistics (Reference period: 2024–25) Regional Population [https://www.abs.gov.au/statistics/people/population/regional-population/latest-release], ABS Website, accessed 13 October 2026.
- National Emergency Management Agency (Reference period: events to June 2026) DRFA Activation History by LGA (file of 11 August 2026) [https://data.gov.au/data/dataset/drfa-activation-history-by-lga], accessed 13 October 2026.
National Emergency Management Agency material is used under a Creative Commons Attribution 2.5 Australia licence. ABS material is used under a Creative Commons Attribution 4.0 International licence. Calculations, standardisations and index readings are APN’s and are not attributable to the ABS.
Disclaimer
The analysis and information contained in this publication are for general informational and strategic purposes only and do not constitute financial, investment, legal, or any other form of professional advice. Australian Property Network is not a licensed financial advisor. Property values and market conditions can go up or down. Before making any property or investment decisions, you must conduct your own thorough research and seek independent professional advice tailored to your specific circumstances. Images are for illustrative purposes only. E.&O.E.
Findings are presented on the basis of data and evidence alone.
