
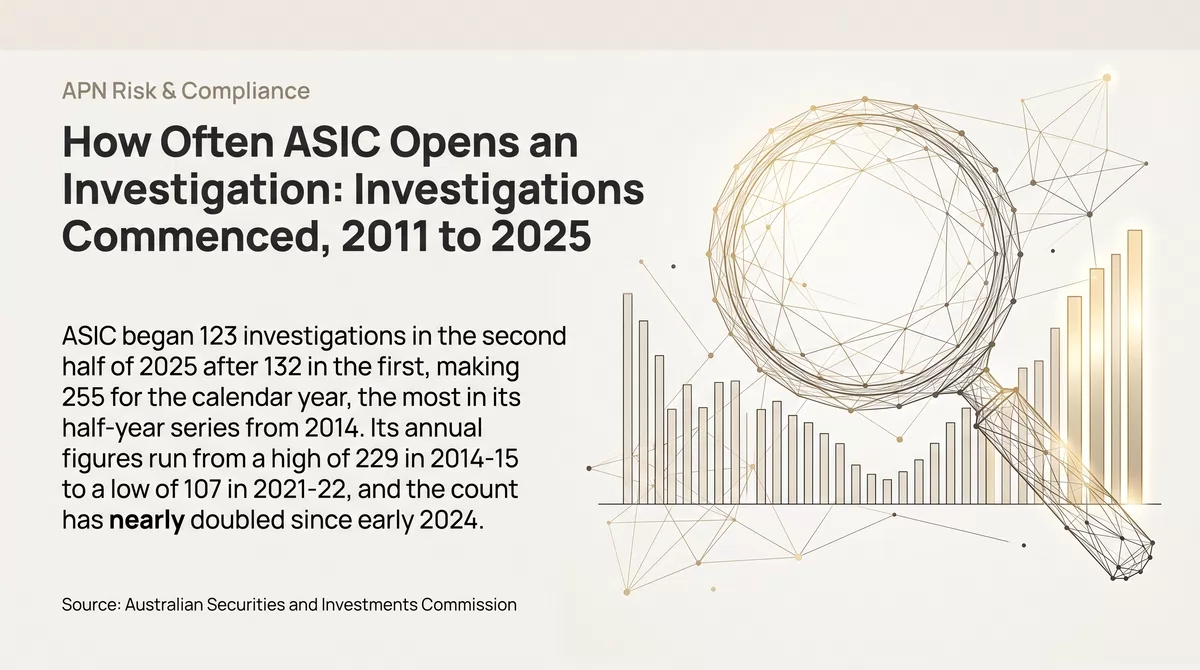

The Australian Securities and Investments Commission began 123 investigations in the second half of 2025, after 132 in the first half. Its 255 for the calendar year is the most in the half-year series, which runs from 2014, and its count for the second half was nearly double the 63 of the first half of 2024. Over the three half-years to December 2025 it began an average of 121 investigations each six months, against 69 from 2017 to mid-2023. ASIC’s own annual figures show the same shape over a longer run: a high of 229 in 2014–15, a low of 107 in 2021–22, and a recovery since.
Counts are of investigations ASIC began, as it publishes them. They measure the regulator’s activity, not the amount of misconduct.
What is counted
ASIC publishes, every six months, the number of investigations it began in the period. The count shows how much new investigative work the regulator has taken on. It is not a measure of how much misconduct there is.
The half-year count runs from July to December 2014. It has been published under the same label through four families of report: enforcement outcomes reports to the first half of 2018, the Enforcement Update series to the end of 2021, quarterly updates to mid-2023, and the summaries of enforcement outcomes since. ASIC’s annual figures go back further, to 2011–12, in a table it gave the Senate Economics References Committee in April 2024.
Six months at a time
Investigations commenced by ASIC, each six months, July–December 2014 to July–December 2025
APN chart based on Australian Securities and Investments Commission data: ASIC enforcement reports and summaries of enforcement outcomes, July 2014 to December 2025. Investigations commenced in each six-month period, as published. The latest period is shaded gold.
The count was highest in the first half of 2015, at 136, and stayed near 100 until 2016. It fell to 57 in the first half of 2017 and stayed between 57 and 77 until 2020, when two half-years of 99 and 107 interrupted the run. The low was 48, in the second half of 2021. Since the first half of 2024 the count has nearly doubled: 63, then 109, 132 and 123. The 132 of the first half of 2025 is the second-highest half-year in the series, after early 2015.
| Six months | Investigations commenced | Published in |
|---|---|---|
| July to December 2014 | 94 | REP 421 |
| January to June 2015 | 136 | REP 444 |
| July to December 2015 | 105 | REP 476 |
| January to June 2016 | 101 | REP 485 |
| July to December 2016 | 98 | REP 513 |
| January to June 2017 | 57 | REP 536 |
| July to December 2017 | 63 | REP 568 |
| January to June 2018 | 67 | REP 585 |
| July to December 2018 | 75 | REP 615 |
| January to June 2019 | 77 | REP 625 |
| July to December 2019 | 60 | REP 660 |
| January to June 2020 | 99 | REP 666 |
| July to December 2020 | 107 | REP 688 |
| January to June 2021 | 52 | REP 699 |
| July to December 2021 | 48 | REP 722 |
| January to June 2022 | 60 | REP 733 |
| July to December 2022 | 62 | REP 757 |
| January to June 2023 | 70 | REP 767 |
| July to December 2023 | 83 | Summary of enforcement outcomes, July to December 2023 |
| January to June 2024 | 63 | Summary of enforcement outcomes, January to June 2024 |
| July to December 2024 | 109 | Summary of enforcement outcomes, July to December 2024 |
| January to June 2025 | 132 | Summary of enforcement outcomes, January to June 2025 |
| July to December 2025 | 123 | Summary of enforcement outcomes, July to December 2025 |
Source: Australian Securities and Investments Commission, ASIC enforcement reports and summaries of enforcement outcomes, July 2014 to December 2025. Each count with the report or summary that published it.
The calendar year
Investigations commenced by ASIC, by calendar year, 2015 to 2025
APN calculation based on Australian Securities and Investments Commission data: ASIC enforcement reports and summaries of enforcement outcomes, July 2014 to December 2025. Investigations commenced by calendar year, the sum of the two half-year counts.
Added up by calendar year, 2025’s 255 investigations are the most in the series, ahead of the 241 of 2015 and well above the 100 of 2021. Calendar 2024 had 172.
The longer history
Investigations commenced by ASIC, by financial year, 2011–12 to 2022–23
APN chart based on Australian Securities and Investments Commission data: Submission to the Senate Economics References Committee Inquiry into ASIC Investigation and Enforcement, 2011–12 to 2022–23, Table 7. Investigations commenced by financial year, labelled by the year in which each financial year ends.
ASIC’s annual figures, which it supplied to the Senate committee inquiring into its investigation and enforcement work, start three years earlier. They rose from 173 in 2011–12 to 229 in 2014–15, fell by more than half to 107 in 2021–22, and were 134 in 2022–23. On the half-year counts the year to June 2025 had 241, more than any financial year in that table, though the two sets of figures do not always agree (see below).
Where ASIC says it is looking
Each year ASIC names the misconduct it most wants to detect and take to court. Its enforcement priorities for 2026 include, for the first time, poor practices in private credit, alongside misleading pricing that affects the cost of living, failures to lodge financial reports, predatory lending to people in financial difficulty, insurers’ handling of claims, and the failure of the Shield and First Guardian master funds, which has its own place on the list. Unscrupulous property investment schemes, a 2025 priority, are not on the 2026 list.
Private credit is where enforcement comes closest to the property market, because much of it is lending against real estate. In October 2026 ASIC made an interim stop order on the disclosure document of three mortgage funds run by Australian Secure Capital Fund, which held $251.8 million at 30 June 2026 in short-term loans secured over Australian property. ASIC said it was concerned that the document did not clearly disclose the loan portfolio or its diversification and might contain a misleading statement. The order is interim, and the fund manager can respond before ASIC decides on a final order.
ASIC describes the change in its own words. Announcing the 2026 priorities, it said in a speech that “we have more investigations, more actions and stronger outcomes”.
What the APN index reads
APN Regulatory Velocity Multiplier™ (24210) combines two measures with equal weight: ASIC’s count of investigations commenced and the number of enforceable undertakings the Australian Prudential Regulation Authority accepted in the latest calendar year, each measured against its own average and each held at its last published value until the next one. It reads +1.1006σ, March quarter 2026, position 97.8, ranked against 46 quarters: close to the top of its history. It reads the March quarter 2026 because ASIC had not, by mid-October 2026, published its count for January to June 2026.
Where the figures disagree
| Financial year | ASIC annual total | Sum of half-years | Difference |
|---|---|---|---|
| 2014–15 | 229 | 230 | +1 |
| 2015–16 | 206 | 206 | 0 |
| 2016–17 | 163 | 155 | −8 |
| 2017–18 | 126 | 130 | +4 |
| 2018–19 | 151 | 152 | +1 |
| 2019–20 | 134 | 159 | +25 |
| 2020–21 | 110 | 159 | +49 |
| 2021–22 | 107 | 108 | +1 |
| 2022–23 | 134 | 132 | −2 |
APN calculation based on Australian Securities and Investments Commission data: Submission to the Senate Economics References Committee, Table 7, and half-year enforcement reports, 2014–15 to 2022–23. The half-year sum adds July to December and the following January to June.
ASIC’s two sets of figures agree to within a few investigations in most years, but not in three. In 2020–21 the two half-year counts add to 159 against an annual total of 110, and in 2019–20 to 159 against 134. ASIC has not published a reconciliation. This article gives each count as ASIC published it.
What this does not show
A count of investigations does not say how large or serious each one is: one investigation can concern a single adviser or a fund with thousands of investors. It does not say how many lead to a court outcome, which can take years. And because ASIC’s count for the first half of 2026 is not yet published, the latest figure here is for July to December 2025.
- Australian Securities and Investments Commission (Reference period: 2011–12 to 2022–23) Submission to the Senate Economics References Committee Inquiry into ASIC Investigation and Enforcement, 16 April 2024 [https://download.asic.gov.au/media/4mehajkd/202404-supplementary-submission-no-1-5-asic-s-investigation-and-enforcement.pdf], accessed 15 October 2026.
- Australian Securities and Investments Commission (Reference period: July to December 2025) Summary of enforcement outcomes, July to December 2025 [https://www.asic.gov.au/about-asic/asic-investigations-and-enforcement/asic-enforcement-outcomes/summary-of-enforcement-outcomes-july-to-december-2025], accessed 15 October 2026.
- Australian Securities and Investments Commission 26-234MR ASIC halts offers in mortgage schemes managed by Australian Secure Capital Fund [https://asic.gov.au/about-asic/news-centre/find-a-media-release/2026-releases/26-234mr-asic-halts-offers-in-mortgage-schemes-managed-by-australian-secure-capital-fund], accessed 15 October 2026.
- Australian Securities and Investments Commission ASIC enforcement outcomes (reports and summaries, July 2014 to December 2025) [https://www.asic.gov.au/about-asic/asic-investigations-and-enforcement/asic-enforcement-outcomes/], accessed 15 October 2026.
- Australian Securities and Investments Commission ASIC enforcement priorities [https://asic.gov.au/about-asic/asic-investigations-and-enforcement/asic-enforcement-priorities/], accessed 15 October 2026.
- Australian Securities and Investments Commission The power and purpose of enforcement (speech) [https://www.asic.gov.au/about-asic/news-centre/speeches/the-power-and-purpose-of-enforcement/], accessed 15 October 2026.
© Australian Securities & Investments Commission: Reproduced with permission. ASIC material is licensed under a Creative Commons Attribution 4.0 International licence.
Disclaimer
The analysis and information contained in this publication are for general informational and strategic purposes only and do not constitute financial, investment, legal, or any other form of professional advice. Australian Property Network is not a licensed financial advisor. Property values and market conditions can go up or down. Before making any property or investment decisions, you must conduct your own thorough research and seek independent professional advice tailored to your specific circumstances. Images are for illustrative purposes only. E.&O.E.
Findings are presented on the basis of data and evidence alone.
