
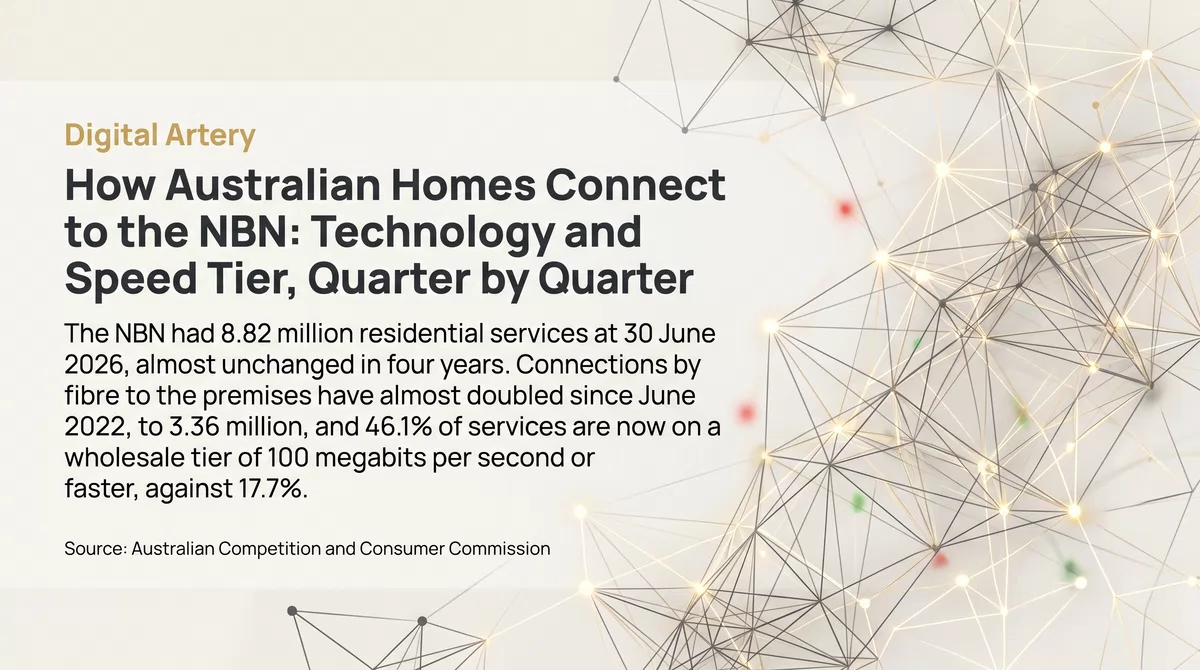

The number of residential services on the National Broadband Network has barely moved in four years: 8.82 million at the end of June 2026, against 8.72 million in June 2022. What has changed is the technology they use and the speed tier they are on. Connections by fibre to the premises have almost doubled, from 1.70 million to 3.36 million, while connections that finish on a copper line have fallen by 1.48 million. And 46.1% of services are now on a wholesale tier of 100 megabits per second or faster, against 17.7% four years ago.
Figures are wholesale services in operation, as reported by NBN Co to the ACCC each quarter.
What is measured
NBN Co is a wholesaler. It sells access to its network to retail providers, who sell broadband plans to households. Each quarter NBN Co reports to the Australian Competition and Consumer Commission how many services it has in operation, by the technology that connects the premises and by the speed tier the retailer has bought. The ACCC publishes the figures as the NBN Wholesale Market Indicators Report. This article uses the 42 quarterly reports from March 2016 to June 2026.
Three points of definition matter. The count is of services on the NBN only; homes connected by another network, or by mobile broadband alone, are not in it. A speed tier is the wholesale tier bought, written as download speed in megabits per second (Mbps); it is not the speed a household receives. And the figures here are for the traffic class that carries household broadband.
Ten years of connections
Residential NBN services in operation, March 2016 to June 2026
APN calculation based on Australian Competition and Consumer Commission data: NBN Wholesale Market Indicators Report, March quarter 2016 to June quarter 2026, Table 1 (services by access technology, traffic class and speed tier). Residential services are wholesale services in traffic class 4, the class that carries household broadband.
The network grew from 941,235 services in March 2016 to more than 8 million by December 2020, as the network was built. Since June 2022 the total has stayed between 8.72 million and 8.84 million: growth of 1.1% in four years. At 30 June 2026, 4,537,881 services were in areas the report classes as metro, 775,592 in outer metro and 3,503,841 (39.7%) in regional areas.
From copper to fibre
Residential NBN services by access technology, millions
APN calculation based on Australian Competition and Consumer Commission data: NBN Wholesale Market Indicators Report, March quarter 2016 to June quarter 2026, Table 1. Residential services in operation by access technology, millions. Fibre to the building, fixed wireless and satellite are in the table below.
The network was built with several technologies. Fibre to the premises runs optical fibre all the way to the home. Fibre to the node, fibre to the curb and fibre to the building run fibre part of the way and finish on an existing copper line. Cable uses the hybrid fibre-coaxial (HFC) networks first built for pay television. Fixed wireless and satellite serve premises outside the fixed-line footprint.
Fibre to the node was the largest technology from September 2017 until December 2024, with a high of 3.10 million services in March 2022. It has fallen in every quarter since, to 2.02 million. Fibre to the premises has risen in every one of the 41 quarters covered and passed fibre to the node in March 2025. In the year to June 2026 alone it added 636,803 services.
| Access technology | June 2022 | June 2026 | Change | Share, June 2026 |
|---|---|---|---|---|
| Fibre to the premises | 1,704,178 | 3,356,052 | +1,651,874 | 38.1% |
| Fibre to the node | 3,099,933 | 2,020,194 | −1,079,739 | 22.9% |
| Cable (HFC) | 2,012,875 | 1,984,702 | −28,173 | 22.5% |
| Fibre to the curb | 1,124,195 | 740,254 | −383,941 | 8.4% |
| Fixed wireless | 393,916 | 388,636 | −5,280 | 4.4% |
| Fibre to the building | 279,894 | 266,937 | −12,957 | 3.0% |
| Satellite | 107,468 | 60,539 | −46,929 | 0.7% |
| Total | 8,722,459 | 8,817,314 | +94,855 | 100.0% |
APN calculation based on Australian Competition and Consumer Commission data: NBN Wholesale Market Indicators Report, June quarter 2022 and June quarter 2026, Table 1. Residential services are wholesale services in traffic class 4, the class that carries household broadband.
Over the four years to June 2026, fibre to the premises gained 1.65 million services and the three technologies that finish on copper lost 1.48 million between them. Cable has stayed close to 2 million throughout the four years. Satellite services have fallen 46% from 112,331 in September 2021, the first quarter in which the report counts Sky Muster Plus services, to 60,539. Fixed wireless held near 400,000 from late 2022 and fell by 15,116 in the year to June 2026.
Speed tiers
Share of residential NBN services by wholesale speed tier
APN calculation based on Australian Competition and Consumer Commission data: NBN Wholesale Market Indicators Report, March quarter 2016 to June quarter 2026, Table 1. Share of residential services by the download speed of the wholesale tier bought, in megabits per second. Tiers sold under plan names are placed with the speed they carried. Fixed wireless and satellite plans without a single stated speed are left out of the four lines.
The mix of speed tiers has shifted three times. Until the end of 2017 more than half of services were on the 25 Mbps tier and about three in ten on 12 Mbps. During 2018 the 50 Mbps tier went from 4.6% of services to 47.7%, and the 25 Mbps tier from 54.4% to 19.7%. The 50 Mbps tier then held more than half of all services in every quarter from March 2019 to March 2023, with a high of 58.1% in December 2021, and again in December 2023.
The third shift is to 100 Mbps and above. Those tiers were 7.9% of services at their low point in March 2019, 17.7% in June 2022 and 31.7% in June 2025. The rise was not steady: the share reached 28.4% in September 2023 and fell back to 20.1% in December 2023, when the 50 Mbps tier was again just over half of services (50.8%). From the September quarter of 2025 the report lists NBN Co’s fastest home tiers at higher speeds on fibre to the premises and cable, an increase the company had announced with no change to wholesale prices: the tier formerly listed at 100 Mbps is listed at 500 Mbps and the 250 Mbps tier at 750 Mbps. Services already on those tiers moved with them, which is why the share on 500 Mbps or faster went from 3.8% to 26.4% in one quarter; on the technologies that finish on copper the same plan stayed at 100 Mbps. From that quarter more services have been on 100 Mbps or faster than on 50 Mbps, for the first time since 2017. By June 2026, 46.1% of services (4.06 million) were on 100 Mbps or faster and 37.0% (3.26 million) on 500 Mbps or faster. Tiers of 12 Mbps or slower, 33.4% of services in March 2016, are down to 3.7%.
| Quarter | 12 Mbps or slower | 25 Mbps | 50 Mbps | 100 Mbps or faster | Of which 500 Mbps or faster | Fixed wireless and satellite plans |
|---|---|---|---|---|---|---|
| June 2016 | 32.3% | 52.1% | 3.7% | 11.9% | 0.0% | 0.0% |
| June 2018 | 28.1% | 27.0% | 35.2% | 9.7% | 0.0% | 0.0% |
| June 2020 | 15.0% | 16.1% | 57.3% | 9.2% | 0.1% | 2.4% |
| June 2022 | 9.7% | 14.1% | 55.4% | 17.7% | 0.6% | 3.1% |
| June 2024 | 5.7% | 20.1% | 46.8% | 24.0% | 2.0% | 3.4% |
| June 2025 | 5.0% | 20.3% | 39.6% | 31.7% | 3.8% | 3.5% |
| June 2026 | 3.7% | 20.2% | 26.7% | 46.1% | 37.0% | 3.3% |
APN calculation based on Australian Competition and Consumer Commission data: NBN Wholesale Market Indicators Report, March quarter 2016 to June quarter 2026, Table 1. Share of residential services by the download speed of the wholesale tier bought, in megabits per second. Tiers sold under plan names are placed with the speed they carried. Fixed wireless and satellite plans without a single stated speed are left out of the four lines.
Technology sets the ceiling
Share of services on 100 Mbps or faster, by fixed-line technology, June 2026
APN calculation based on Australian Competition and Consumer Commission data: NBN Wholesale Market Indicators Report, June quarter 2026, Table 1. Share of residential services on each fixed-line technology bought on a wholesale tier of 100 megabits per second or faster; the share on 500 megabits per second or faster is shown beside each bar.
The two shifts are connected. On fibre to the premises, 69.8% of services were on 100 Mbps or faster in June 2026 and 66.0% on 500 Mbps or faster. On cable the figures were 55.3% and 52.7%. On the copper-finished technologies the report shows no service on a tier above 100 Mbps, and 16.7% of fibre to the node services and 24.8% of fibre to the curb services were on the 100 Mbps tier. The tiers of 500 Mbps and above are bought only on fibre to the premises and cable.
What this does not show
These are wholesale figures. They show the tier a retailer has bought for a service, not the speed delivered to the home at busy times, and not what the household pays. They cover the NBN only, so they do not show how many homes use another fibre network, a mobile connection or a satellite service from another operator; a fall in NBN satellite or fixed wireless services does not by itself show where those premises went. The report does not publish technology by suburb, so it cannot show which places have moved from copper to fibre. The ACCC notes that the report is not intended to give a reliable view of any retailer’s share of the market, and this article gives none.
- Australian Competition and Consumer Commission (Reference period: March quarter 2016 to June quarter 2026) NBN Wholesale Market Indicators Report, quarterly disclosure tables, 31 March 2016 to 30 June 2026 [https://www.accc.gov.au/by-industry/telecommunications-and-internet/national-broadband-network-nbn-access-regulation/nbn-wholesale-market-indicators-report/previous-reports], accessed 12 October 2026.
- NBN Co nbn plans to accelerate highest speed tiers (media statement, 4 March 2024, updated 12 March 2024) [https://www.nbnco.com.au/corporate-information/media-centre/media-statements/nbn-plans-to-accelerate-highest-speed-tiers], accessed 13 October 2026.
Based on ACCC data. ACCC material is used under a Creative Commons Attribution 4.0 International licence. The figures are drawn from reports prepared by NBN Co for the ACCC. Calculations are APN’s and are not attributable to the ACCC or NBN Co.
Disclaimer
The analysis and information contained in this publication are for general informational and strategic purposes only and do not constitute financial, investment, legal, or any other form of professional advice. Australian Property Network is not a licensed financial advisor. Property values and market conditions can go up or down. Before making any property or investment decisions, you must conduct your own thorough research and seek independent professional advice tailored to your specific circumstances. Images are for illustrative purposes only. E.&O.E.
Findings are presented on the basis of data and evidence alone.
