
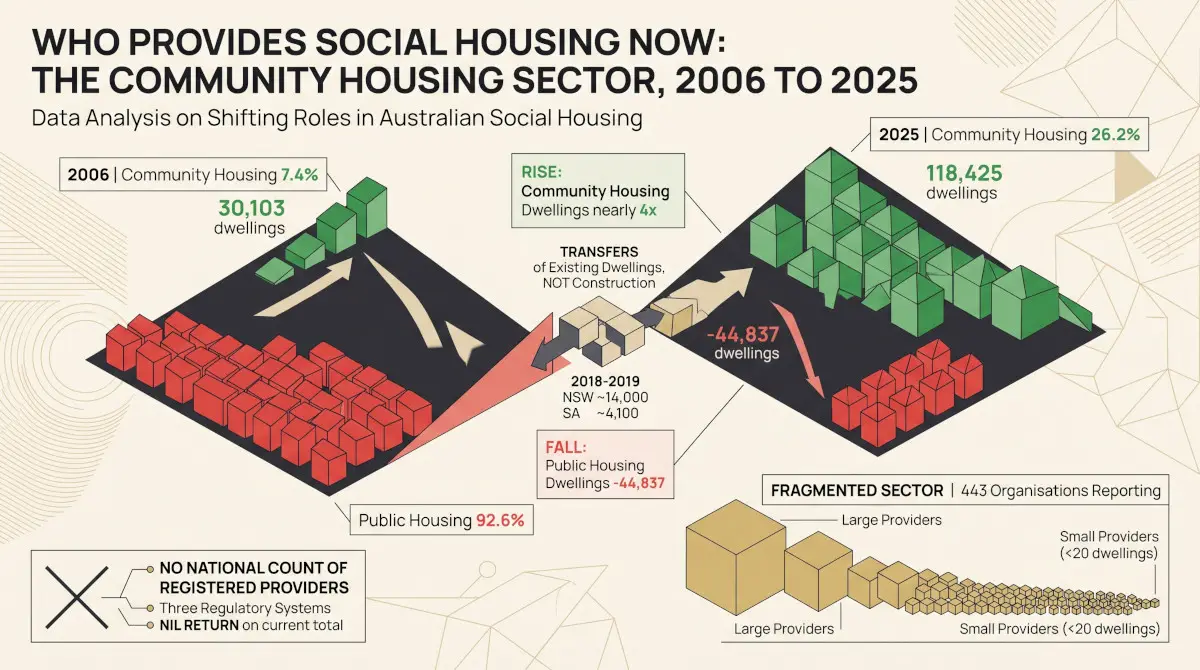

Community housing held 30,103 dwellings in June 2006 and 118,425 in June 2025, taking its share of Australia’s social housing from 7.4% to 26.2%. Public housing fell by 44,837 dwellings over the same period. Part of that shift was transfer rather than construction: state governments handed existing dwellings to not-for-profit providers to manage, about 14,000 in New South Wales in 2018–19 and 4,100 in South Australia the year before. The sector that received them is not consolidated. 443 organisations reported community housing dwellings in 2025, and 223 of them managed fewer than 20.
Node reading for Housing Policy (Affordable, Social) (21330): NIL RETURN. This article rests on the source data alone.
What community housing is
Social housing is rental housing let below market rent to eligible households. It is delivered through several programs, and the two largest are public housing, owned and managed by state and territory housing authorities, and community housing, managed by not-for-profit organisations. The stock of social housing as a whole, and how it compares with the dwelling stock, is set out in Social Housing as a Share of All Dwellings, 2012 to 2025; what the separate term “affordable housing” means in each jurisdiction is set out in What Affordable Housing Means, Jurisdiction by Jurisdiction.
Community housing providers do not all own what they manage. Some own their dwellings, some manage dwellings still owned by a state housing authority, and many do both. The count below is of dwellings under management, reported by the Australian Institute of Health and Welfare (AIHW) as tenancy units.
A quarter of social housing, from a thirteenth
In June 2006 community housing held 30,103 dwellings, 7.4% of all social housing. By June 2025 it held 118,425, or 26.2%. The stock is nearly four times its 2006 level. Public housing moved the other way, from 341,378 dwellings to 296,541, a fall of 44,837. Total social housing grew by 45,233 dwellings over the nineteen years, so the change within it is far larger than the change to it.
Social housing dwellings by program, 2006 to 2025
Thousands of dwellings at 30 June. Public housing and community housing only; state owned and managed Indigenous housing and Indigenous community housing are counted in the totals in the table below but not shown here. Source: AIHW, Housing assistance in Australia 2026, table DWELLINGS.1.
| At 30 June | Community housing | Public housing | All social housing | Community share |
|---|---|---|---|---|
| 2006 | 30,103 | 341,378 | 406,566 | 7.4% |
| 2011 | 57,506 | 331,371 | 421,005 | 13.7% |
| 2016 | 80,226 | 320,041 | 432,846 | 18.5% |
| 2019 | 100,205 | 305,191 | 437,718 | 22.9% |
| 2021 | 108,519 | 299,520 | 440,192 | 24.7% |
| 2025 | 118,425 | 296,541 | 451,799 | 26.2% |
Dwellings at 30 June. All social housing includes state owned and managed Indigenous housing, Indigenous community housing and, to 2016, Northern Territory remote public housing. Source: AIHW, Housing assistance in Australia 2026, table DWELLINGS.1.
Growth by transfer, not only by building
The two largest single-year rises were 13,178 dwellings in the year to June 2011 and 12,386 in the year to June 2019. For the second, the AIHW records the reason: about 14,000 dwellings moved from public housing and state owned and managed Indigenous housing to community housing in New South Wales in 2018–19. The recorded New South Wales stock rose 11,212 that year; the AIHW’s figure is a rounded description of the transfer program rather than of the single reporting year. South Australia’s transfer of about 4,100 came the year before, in 2017–18, and shows as a rise of 4,077 in that year. More than 2,000 Tasmanian public housing dwellings followed between 2021 and 2022. A transfer changes who manages a dwelling; it does not add one to the stock.
That is why the two lines mirror each other: a dwelling leaving one program arrives in the other. The transfers the AIHW names account for roughly a fifth of community housing’s increase over the period; the rest is not separately identified in the published data. Over the nineteen years the social housing stock grew by 11.1%, while community housing’s share of it more than tripled. In the year to June 2025 the community housing count fell by 392, its first fall of the period, and its share slipped from 26.3% to 26.2%.
Many small providers, and a few large ones
443 organisations reported community housing dwellings in 2025. Half of them, 223, managed fewer than 20 dwellings each. The size distribution is the sector’s defining feature: a long tail of organisations managing a handful of dwellings, many of them serving a single town or community, alongside 91 managing 200 or more.
Community housing providers by number of dwellings managed, 2025
Number of organisations reporting community housing dwellings at 30 June 2025. Source: AIHW, Housing assistance in Australia 2026, table DWELLINGS.12.
How much stock the largest providers hold is published for one state only. The New South Wales Registrar of Community Housing reports 250 providers regulated at 30 June 2025; those registered nationally hold 70,747 properties, of which its 44 Tier 1 providers, the largest tier, hold 58,323, or 82.4%. No equivalent national figure is published.
Three regulators, and no national total
Community housing providers are regulated under the National Regulatory System for Community Housing in six states and territories, and separately by a Victorian registrar and a Western Australian registrar. The three systems keep their own registers, and the national regulator reports that some of its providers also operate in Victoria or Western Australia. Adding the registers together would risk counting the same organisation twice.
The national system last published a provider count of 347 at 30 June 2024; its later reports cover performance rather than numbers, and neither the Victorian nor the Western Australian registrar publishes a headline count. A current national count of registered providers is therefore NIL RETURN. The 443 organisations counted above are those that reported to the AIHW collection, which is a different measure: it includes providers in every state, registered or not, and excludes any that did not report.
Where community housing carries the load
The balance between the programs differs sharply by state. In Tasmania community housing holds 66.3% of social housing, the result of successive transfers to not-for-profit management. In the Northern Territory it holds 7.1%: most of the Territory’s social housing sits in state owned and managed Indigenous housing, 5,789 dwellings, and public housing, 4,129, with a further 1,984 in Indigenous community housing.
Community housing as a share of social housing, by state and territory, 2025
Per cent of all social housing dwellings at 30 June 2025, including state owned and managed Indigenous housing and Indigenous community housing in the denominator. Source: AIHW, Housing assistance in Australia 2026, table DWELLINGS.2.
| State or territory | Community housing | All social housing | Community share |
|---|---|---|---|
| Tasmania | 10,430 | 15,739 | 66.3% |
| New South Wales | 52,439 | 158,363 | 33.1% |
| South Australia | 13,010 | 46,678 | 27.9% |
| Victoria | 19,625 | 86,048 | 22.8% |
| Queensland | 13,158 | 75,582 | 17.4% |
| Western Australia | 7,611 | 44,238 | 17.2% |
| Australian Capital Territory | 1,246 | 12,343 | 10.1% |
| Northern Territory | 906 | 12,808 | 7.1% |
Dwellings at 30 June 2025. Source: AIHW, Housing assistance in Australia 2026, table DWELLINGS.2.
What these counts do not show
A dwelling count is not a measure of how well a sector houses people. It says nothing about rents charged, the condition of the dwellings, how long tenants wait or how they are allocated. Nor does the provider count measure capacity: an organisation managing 15 dwellings and one managing 15,000 count alike.
The AIHW counts organisations that report to its collection, so the provider figure moves when reporting changes as well as when the sector does. The Northern Territory’s community housing data came from government administrative records before 2025, so its provider count is not comparable with earlier years, and the national provider count is published here for 2025 alone rather than as a series. Organisations whose dwelling count is not known are reported by the AIHW in its smallest band, so the 223 managing fewer than 20 is an upper bound on that group. Community housing is counted in tenancy units. Indigenous community housing is a separate program throughout, counted in the social housing totals but not in the community housing figures.
Findings are presented on the basis of data and evidence alone.


