
Dating the Supply Decline: Completions Fell Before the Tax Fight, and Starts Have Already Turned
New Housing Supply Forecasts (21520) +1.6228σ Q1 2026
Construction Costs & Supply Chain (21260) +1.3708σ Q1 2026
Inflation (21220) +2.1049σ Q2 2026
Scope and Purpose
On 31 August 2026, The Elephant In The Room Property Podcast published a 46-minute interview with Senator Andrew Bragg, the Shadow Minister for Housing and Homelessness, on whether the 2026 Budget’s changes to negative gearing and the capital gains tax discount will make housing more affordable or simply change who owns it. The Senator’s case rests on four empirical propositions: that housing supply has fallen from about 200,000 dwellings a year to about 170,000; that net overseas migration has risen from a bit under 200,000 a year to a bit over 400,000; that the Budget’s tax changes reduce supply by design, with Treasury itself forecasting 35,000 fewer houses; and that the industry cannot make money building homes. His full argument, and the two hosts’ practitioner counter-cases, are carried in the companion Policy Commentary & Critique output, Bragg: Fewer Houses by Design. This output does one narrower thing. It puts each of the four propositions against the primary series they rest on, and against Australian Property Network’s (APN’s) own certified readings, and reports where they hold, where they hold with qualification, and where they do not. The short answer is that the supply decline is real but older than the argument about it, and the pipeline has already turned in a way neither side of that argument has yet acknowledged.
Proposition One: From 200,000 to 170,000
The ABS Building Activity series settles the size of the decline and, more importantly, its timing. Total dwellings completed, seasonally adjusted and summed by calendar year, ran to 219,489 in 2018, 202,713 in 2019, 181,720 in 2020 and 178,940 in 2021. That is an 18.5% fall over three years. From 2022 the series flattens: 173,543 in 2022, 176,704 in 2023, 178,497 in 2024 and 173,036 in 2025, with the year to March 2026 at 173,367. The four post-2021 years average 175,445 and sit inside a band less than 5,500 dwellings wide. Every dwelling of the fall from 219,000 to 179,000 was booked before the May 2022 change of government; the four years since have been flat, not falling.
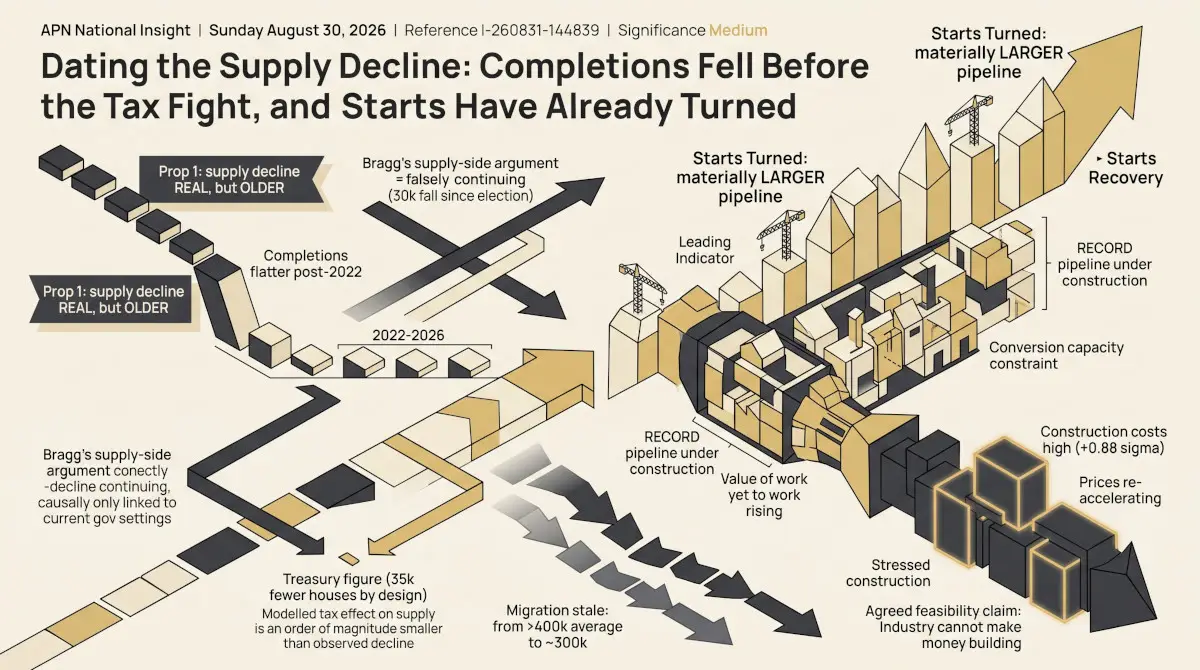
Both of the Senator’s figures therefore survive as arithmetic. The 170,000 is a modest rounding-down of a flat 175,000, and a 200,000 average for the previous government’s nine years is plausible when 2018 and 2019 alone contributed 219,000 and 203,000. What does not survive is the causal framing attached to them: that the current government has “reduced supply by 30,000 a year on average since they came to office”. Completions were already at 179,000 in the calendar year before the election. Relative to that starting point, the post-election average is about 3,500 lower, not 30,000. The 30,000 gap exists only when the comparison reaches back to 2018 and 2019, and the fall it measures occurred under the previous government’s own settings. What the data describes since 2022 is stagnation at a low level, which is a different diagnosis from continued decline and calls for different remedies.
Dwellings Commenced and Completed, Mar 2018 – Mar 2026
Source: ABS 8752.0 Building Activity, Australia, March 2026 quarter (released 8 July 2026). Total sector dwelling unit commencements and completions, seasonally adjusted, dwellings per quarter. Dashed line marks the June quarter 2022.
What the Pipeline Says Now
Completions are the lagging indicator in this system. Commencements lead them by roughly a year for detached houses and two years or more for apartments, and it is commencements that the Senator’s framing overlooks. Total dwellings commenced peaked at 229,351 in 2021 on the HomeBuilder pull-forward, fell to 182,927 in 2022 and troughed at 166,305 in 2023. They then rose to 169,228 in 2024 and 197,256 in 2025, a 16.6% increase in a single year, with the year to March 2026 at 197,341. The trend series reached 51,009 in the March quarter, the second consecutive quarter above 50,000 and the first such run since the December quarter of 2021, which annualises to a little above 204,000. The pipeline that will determine completions in 2027 and 2028 is materially larger than the one that produced 2025’s 173,000. This is the movement that New Housing Supply Forecasts (21520) registers at +1.6228σ for the March quarter: the leading edge of supply is running well above its own long-run norm, whatever the completions count currently says.
The stock in between the two counts confirms it. Dwellings under construction stood at 243,864 at the end of March 2026, the highest level in the published series since at least 2018 and above the previous high set in the September quarter of 2022. Starts are being added to the pipeline faster than the sector can discharge them. APN’s Crowded Out output of 30 August documented the mechanism: the value of residential work yet to be done per dwelling under construction has risen about 60% in five years, of which roughly two-fifths is real rather than cost inflation, meaning each project in the pipeline now represents materially more unfinished work than it did in 2021. Starts have turned; what has not turned is the sector’s capacity to convert them into completions. That is the constraint the completions series is measuring, and it is not a tax-policy variable.
Dwellings Under Construction, Mar 2018 – Mar 2026
Source: ABS 8752.0 Building Activity, Australia, March 2026 quarter. Total sector dwelling units under construction at end of quarter, original.
Proposition Two: “Fewer Houses by Design”
The Senator’s citation of Treasury is accurate. The Budget of 12 May 2026 published modelling attributing to the negative gearing and capital gains changes roughly 2% slower dwelling price growth relative to no policy change, an increase in median rents of less than $2 a week, about 75,000 additional first home owners, and about 35,000 fewer privately supplied dwellings. What the citation omits is the denominator: the 35,000 is a ten-year figure. Spread across the decade it is about 3,500 dwellings a year, roughly 2% of the current completions run-rate and less than a tenth of the roughly 40,000 by which annual completions fell between 2018 and 2021. The modelled tax effect on supply is an order of magnitude smaller than the observed decline it is being argued alongside. The Budget also claims an offset, a $2 billion Local Infrastructure Fund expected to unlock about 65,000 dwellings, which the Senator dismisses as politics.
Two cautions run in the other direction, and they cut against both parties to the argument. First, the 65,000 offset is as much a modelled estimate as the 35,000 it is set against, and neither figure describes anything the observed data can yet see: the tax changes commence on 1 July 2027 and no series carries an effect from them today. Second, APN’s Construction Paradox and Crowded Out outputs found that the binding constraint on housing supply is conversion capacity, not approvals and not investor demand. An infrastructure fund, whether the government’s $2 billion or the Coalition’s proposed $5 billion, relieves developer cost; it does not add trade labour or shorten build times. Both the 35,000 and the 65,000 are estimates about a margin that is small against the capacity problem, and neither should be cited as a fact about supply.
Proposition Three: Migration From Under 200,000 to Over 400,000
The ABS records net overseas migration of 538,000 in 2022-23, a record, 429,000 in 2023-24 and 306,000 in 2024-25. The average of the three completed financial years under the current government is about 424,000, so “a bit over 400,000” is arithmetically correct. It is also stale. The most recent annual reading, for the year to 31 December 2025, is 301,000, which is 29% below that average and 44% below the 2022-23 peak. Annual net overseas migration has now fallen for two consecutive years, and the ABS notes that migrant arrivals in 2024-25 were only 3% above 2018-19 while departures remained 15% below, so the residual elevation is a departures effect, not an arrivals effect. A demand-side argument built on the 400,000 figure is describing conditions that ended roughly eighteen months ago.
The comparator is stale in the same way. The sub-200,000 average attributed to the previous government is arithmetically dependent on the pandemic: net overseas migration was a net loss of 85,000 in 2020-21, the lowest since the First World War, and 171,000 in 2021-22 as borders reopened. Before the pandemic the same government recorded 262,500 in 2016-17. The current run-rate of about 300,000 therefore sits between the two averages being contrasted, above the pre-pandemic readings and well below the 2022 to 2024 peak. Both averages are correct, and both describe periods that have ended. The Senator’s stated target of returning net overseas migration to “a reasonable level” is not quantified in this interview; the ABS series suggests the number has already moved most of the way from its peak toward the pre-pandemic range without a policy change to drive it.
Proposition Four: The Industry Cannot Make Money Building
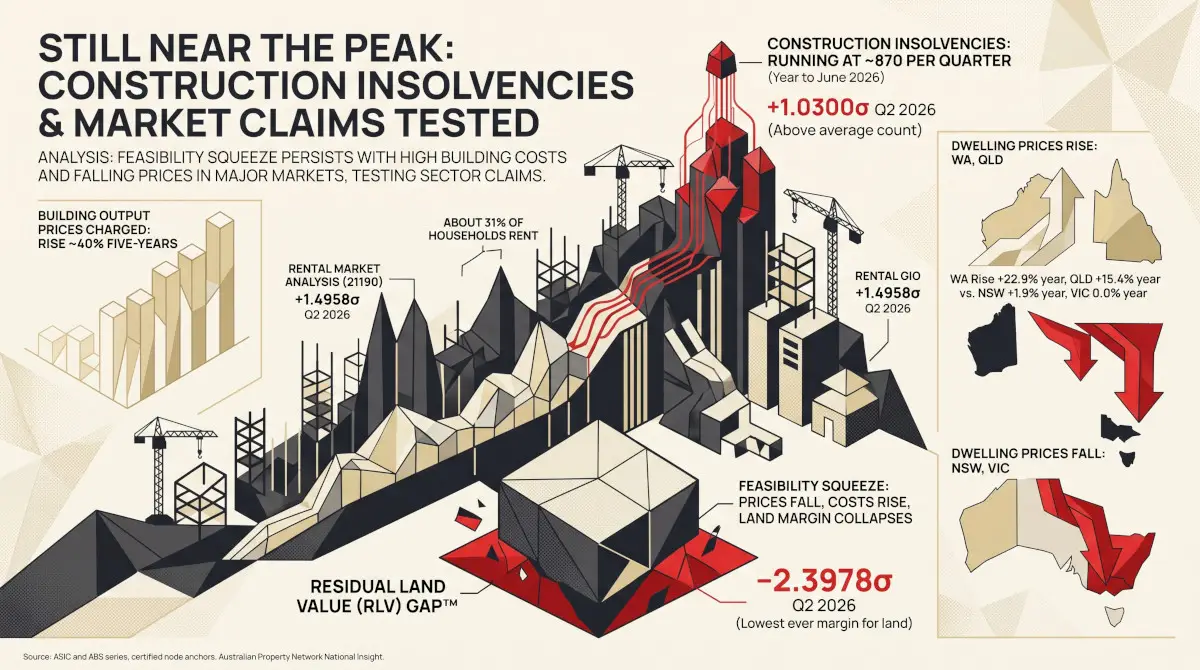
This is the one proposition on which APN’s certified readings speak directly, and it is the one that holds without qualification. Construction Costs & Supply Chain (21260) reads +1.3708σ for the March quarter (recertified on a repaired insolvency input, a measurement change rather than a change in conditions), an elevated reading before the June-quarter data. That June-quarter data, documented in Crowded Out, showed producer prices for house-construction inputs rising 2.1% in the quarter, the largest quarterly increase since December 2022, to 3.8% over the year, and the consumer price measure of new dwelling purchase rising 5.8% over the year from a low of 0.4% twelve months earlier. Inflation (21220) reads +2.1049σ for the June quarter, the most stretched of the three anchors, and describes the broader price environment in which builders are pricing contracts. The feasibility claim is the strongest-supported proposition in the interview, and it is the one on which the Senator, both hosts and the data agree.
What the certified readings add is scale and sequence. Cost re-acceleration is coinciding with a record pipeline and a two-year recovery in starts. Costs rising while volumes rise is the signature of a capacity constraint, not a demand shortfall: the sector is being asked to do more than it can staff and supply at current prices, and is repricing accordingly. That reading is consistent with the completions series staying flat while commencements rise, and with the growth in unfinished work per dwelling. It leaves the tax argument secondary. A sector that cannot convert a record pipeline into completions at current cost levels has a problem that the tax treatment of established-dwelling investors did not cause and, on Treasury’s own modelling, does not materially change in either direction.
APN Analytical Synthesis
Of the Senator’s four empirical propositions, three survive as arithmetic and two fail as diagnosis. The completions decline is real and correctly sized, but it was complete before May 2022 and completions have been flat since; the supply decline being litigated in 2026 is a 2018 to 2021 event. The migration average is correct and stale; the current annual reading is 301,000, and the sub-200,000 comparator depends on two years of closed borders. The Treasury figure of 35,000 fewer dwellings is correctly cited and, once its ten-year horizon is restored, small against the observed history. The feasibility proposition is supported by APN’s own certified readings on construction costs and inflation, and is the one point of substantive agreement across the interview. Read together, the primary data supports the Senator’s premise, that supply is the main game, considerably better than it supports his account of who moved it and when.
The forward question is not whether supply fell but whether the turn in commencements converts. Starts up 16.6% in 2025, the trend above 50,000 a quarter for the first time since 2021, dwellings under construction at a series high and New Housing Supply Forecasts (21520) at +1.6228σ all say the pipeline has turned. Input costs re-accelerating at the same moment say the conversion of that pipeline into finished dwellings will be slower and more expensive than the start count implies. The next completions release, not the next round of the tax debate, will show whether the supply decline has ended; the 7 October 2026 Building Activity release carries June-quarter commencements, completions and work yet to be done. This synthesis speaks only to the structural conditions the cited data can independently support; it does not constitute a view on future dwelling volumes, prices, migration settings or policy, and no such view is expressed or implied.
Disclaimer
The analysis and information contained in this publication are for general informational and strategic purposes only and do not constitute financial, investment, legal, or any other form of professional advice. Australian Property Network is not a licensed financial advisor. Property values and market conditions can go up or down. Before making any property or investment decisions, you must conduct your own thorough research and seek independent professional advice tailored to your specific circumstances.