
The Affordability Ceiling: Deconstructing the Structural Constraint on Australian Property
APN ANALYSIS: A-250929-AUS01
Executive Summary
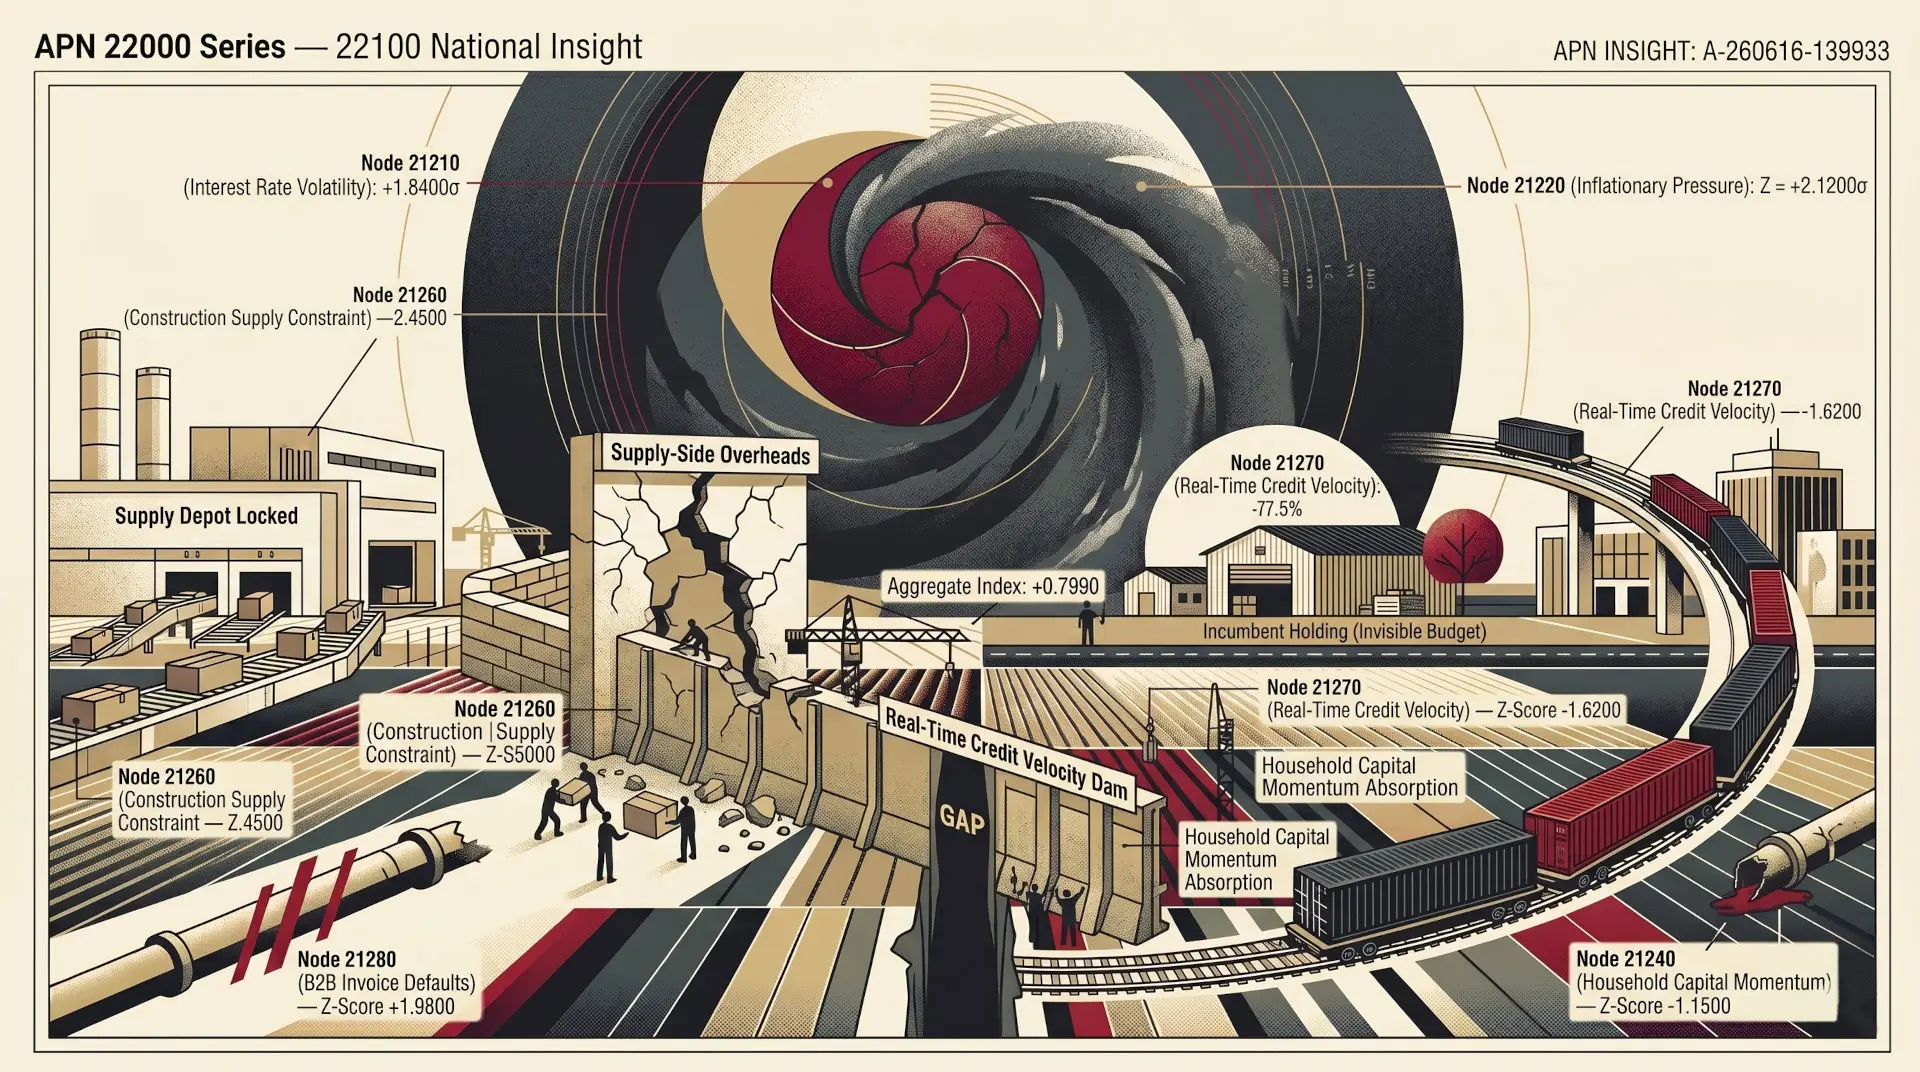
Housing affordability has deteriorated to a structural crisis, with new data showing mortgage serviceability now requires approximately 50.5% of the median household gross income nationally. This extreme financial pressure, driven by a 30-35% collapse in borrowing capacity since May 2022, has now become the primary constraint on price growth in Australia’s key markets.
This analysis deconstructs how this affordability ceiling is functioning as a structural cap on Sydney and Melbourne, overriding strong demand drivers like migration. The strategic implication is a bifurcated, two-speed market, where capital and investors are increasingly “crowded out” of major capitals and funnelled into more affordable markets like Perth and Brisbane, which now offer superior yield and growth potential.
Background & Strategic Context
This event is not an isolated market fluctuation; it is the direct outcome of long-term forces and deliberate policy actions that our core intelligence frameworks are designed to track.
A Deliberate Policy Intervention: (Project Overlord): The 30-35% reduction in borrowing capacity is not an organic market event; it is a direct and deliberate consequence of state-level policy intervention. The RBA’s aggressive tightening cycle, combined with APRA’s mandated 3% serviceability buffer, was explicitly designed to curb inflation by reducing demand. This affordability crisis is the intended result of that policy, demonstrating Project Overlord’s thesis that regulatory and monetary levers are the primary force shaping market boundaries, superseding simple supply and demand.
A Market Fracture Along Capital Lines: (The Wealth Funnel): This affordability ceiling is a powerful manifestation of The Wealth Funnel in action. The data clearly shows a market fracturing along lines of existing capital. For First Home Buyers, the 10-12 year deposit-saving time in Sydney creates an almost insurmountable barrier to entry. For investors, high entry prices and poor yields in Sydney and Melbourne make positive cash flow challenging. This crisis acts as a filter, “crowded out” wage-dependent FHBs and less-capitalised investors, while funnelling those who can still transact (i.e., those with high equity or high incomes) towards a narrowing pool of assets.
Deconstruction of the Source Event
The internal intelligence brief provides the following verifiable metrics quantifying the affordability constraint:
- Dwelling Value-to-Income Ratios: Sydney now sits at approximately 9.8 times the median household income, with Melbourne at 8.1 times. A ratio above 4-5 is historically considered unaffordable.
- Mortgage Serviceability: Nationally, servicing a new mortgage on a median-priced dwelling requires 50.5% of the median household gross income. Furthermore, AIHW data estimates almost 45% of all households with a mortgage are now in “housing stress,” spending over 30% of their disposable income on housing costs.
- Borrowing Capacity: The maximum borrowing capacity for a typical dual-income household has fallen by 30-35% since the RBA’s tightening cycle began in May 2022.
- First Home Buyer (FHB) Impact: The time required to save a 20% deposit is now estimated at 10-12 years in Sydney and 8-10 years in Melbourne.
- FHB Schemes: Government interventions like the Home Guarantee Scheme (5% deposit) are noted to dramatically reduce this deposit-saving time, but expose buyers to higher LVRs and potential negative equity risk.
- Investor Impact: Analysis shows investors are increasingly favouring more affordable markets like Perth and Brisbane, where rental yields are higher and entry prices are lower.
Critical Analysis & Balanced View
The source data provides a clear picture of market strain. However, the critical insights lie in the second- and third-order effects of this data.
The “Real” Story: A Structural Market Bifurcation. The key insight is that the affordability ceiling in Sydney and Melbourne is no longer a temporary cyclical feature; it is a structural cap on growth. This pressure is creating a two-speed market. Capital that would have flowed to Sydney/Melbourne is now being strategically redeployed to markets like Perth and Brisbane, which will likely see sustained outperformance until they, too, hit their own affordability ceilings.
Strategic Paradox: FHB Schemes Increase Systemic Risk. Government interventions like the Home Guarantee Scheme (5% deposit) are a strategic paradox. While they reduce the time-to-save barrier, they do not solve the serviceability crisis. Instead, they encourage new buyers to take on high-LVR debt at a time of maximum price and interest rate pressure, increasing their vulnerability to negative equity and creating a new pocket of systemic risk.
Challenged Assumption: The “No Widespread Defaults” Consensus. The consensus that “widespread defaults are not forecast” overlooks a more immediate economic drag. With ~45% of mortgaged households in “housing stress”, the impact on discretionary retail spending will be severe. This creates a powerful economic headwind that will cripple broader GDP growth and place a political ceiling on the RBA’s ability to keep rates high, regardless of the inflation print.
Balanced View: The data from the internal brief is factually correct, affordability is the primary constraint tempering price growth. However, to view this merely as a “constraint” is to miss the strategic shift. This affordability crisis is actively re-architecting the Australian property market, structurally capping our two largest cities, creating systemic risk through well-intentioned policy, and funnelling capital into new growth corridors, a trend that will define market performance for the foreseeable future.
Strategic Implications for Property Professionals
- For Developers: Project viability in Sydney and Melbourne is now critically dependent on targeting high-equity downsizers or high dual-income professionals. The FHB market is structurally locked out of most new developments. Focus must shift to smaller, more affordable dwelling designs or “Build-to-Rent” (BTR) models that service the growing cohort of permanent, high-income renters.
- For Agents & Valuers: Historical growth models for Sydney and Melbourne are no longer reliable. Valuations must now heavily overweight serviceability constraints and borrowing capacity limits. Agents must condition vendors for flatter price outcomes and longer days on market. The “outperformance” narrative has definitively shifted to Perth, Brisbane, and Adelaide.
- For Investors: The strategy of leveraging high capital growth in Sydney and Melbourne to offset low yields is broken. As the brief identifies, investment strategy must pivot to yield-focused markets like Perth and Brisbane. The affordability ceiling in major capitals means capital growth is capped, while cash-flow-positive assets in more affordable cities now represent the superior risk-adjusted return.
- For Lenders & Brokers: The 30-35% reduction in borrowing capacity is the entire market. Business models must adapt to processing lower loan sizes per customer and managing significantly higher application scrutiny. Expect a surge in applications for low-deposit FHB schemes, which, as the brief notes, carry a higher risk profile and require rigorous assessment for potential negative equity.
Disclaimer
The analysis and information contained in this deconstruction are for general informational and strategic purposes only and do not constitute financial, investment, legal, or any other form of professional advice. The Australian Property Network (APN) is a strategic intelligence organisation and is not a licensed financial advisor.
This analysis is based on data and information from third-party sources believed to be reliable; however, APN provides no warranty as to its accuracy, currency, or completeness. Images used in this analysis are for illustrative and conceptual purposes only and may not represent real persons, properties, or events.
Property values and market conditions can go down as well as up.
Before making any property or investment decisions, you must conduct your own thorough research and seek independent professional advice tailored to your specific circumstances.