
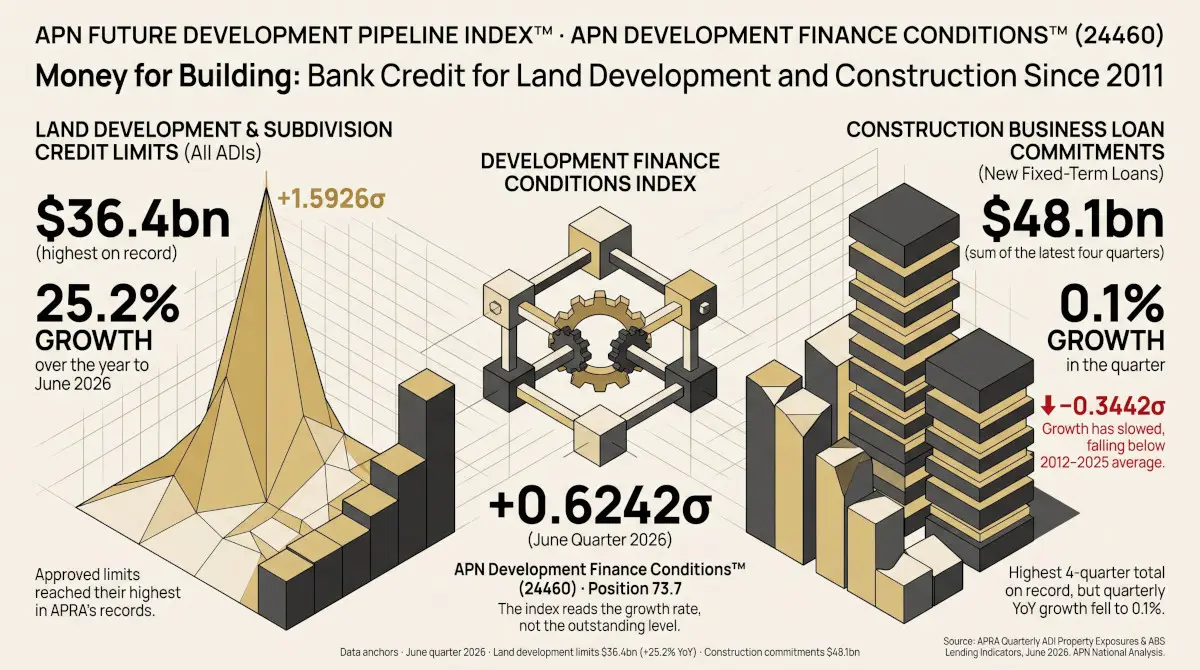

Lenders’ approved credit limits for land development reached $36.4bn at the end of June 2026, the highest in APRA’s records, which begin in 2004. Over the four quarters to June, lenders committed $48.1bn in new fixed-term business loans for construction, the most on record, narrowly above the year to March. In the same quarter APN Development Finance Conditions™ (24460) eased to +0.6242σ, from the highest reading in its series in March. Both are true because the index measures how fast development finance is growing, not how much of it there is. Land development limits grew 25.2% over the year, after more than 30% in each of the two previous quarters, and the June quarter’s construction lending only matched the unusually large June quarter of 2025.
The index measures the growth of development finance against its own record since 2012, not the amount outstanding.
Two measures of money for building
The index draws on two published measures. The first is from the Australian Prudential Regulation Authority’s Quarterly ADI Property Exposures: the credit limits that banks and other authorised deposit-taking institutions (ADIs) have approved for land development and subdivision. A limit is the ceiling on a facility the lender has agreed to provide, not the amount drawn, so it records how much finance lenders are prepared to extend.
The second is from the ABS Lending Indicators: new fixed-term loans committed to businesses for construction in each quarter. It counts new lending as it is agreed, and it covers lending for all types of construction, including offices, warehouses and infrastructure as well as homes: in the four quarters to June 2026, $23.1bn of it, 48.0%, was for building dwellings.
Both are in current dollars and are not adjusted for rising building costs.
Land development limits: flat for two years, then a series high
Land development and subdivision credit limits, all ADIs, March quarter 2011 to June quarter 2026
$ billion, end of quarter, current prices. Quarterly from December 2008; the series is shown from March 2011. APN chart based on Australian Prudential Regulation Authority data: Quarterly ADI Property Exposures, June 2026, Table 1a (commercial property exposure limits, land development/subdivisions, all ADIs).
Through 2023 and 2024 land development limits held between $24.4bn and $25.3bn. From the start of 2025 they rose in every quarter, reaching $36.4bn in June 2026, 46.6% above the end of 2024 and the highest level in the series. Growth over the year was above 30% in the December and March quarters and 25.2% in the June quarter. Most of the limit is in use: drawn land development exposures were $34.5bn in June 2026, the highest on record and 94.7% of the limit, against 64.2% in September 2021.
The June and December figures include APRA estimates for the smallest lenders: only the banks with the largest commercial property books, about 99% of the total, report in those quarters, and the rest are estimated from their earlier returns.
Construction lending: the largest year in the series, and a volatile quarter
New fixed-term business loan commitments for construction, by quarter, March quarter 2019 to June quarter 2026
APN chart based on Australian Bureau of Statistics data: Lending Indicators, June 2026, Table 29 (A130267691V). $ billion, original series, current prices. Fixed-term business loans for construction, all types of construction.
New construction loan commitments were $13.6bn in the June quarter of 2026, the largest quarter on record, though only just above June 2025 ($13,624m against $13,616m). Growth on the same quarter a year earlier therefore fell from 55.3% in March to 0.1% in June, although the amount lent in the quarter was higher than in March.
New fixed-term business loan commitments for construction, total of the latest four quarters, March quarter 2011 to June quarter 2026
APN calculation based on Australian Bureau of Statistics data: Lending Indicators, June 2026, Table 29 (A130267691V). $ billion, sum of the latest four quarters, current prices.
Quarterly commitments move a great deal from one quarter to the next, so the four-quarter total is the steadier guide. It was $48.1bn in the year to June 2026, 16.0% more than a year earlier and 70.6% more than two years earlier, when it stood at $28.2bn.
Growth, not level, is what the index reads
Growth over the year in land development limits and construction loan commitments
Change on the same quarter a year earlier, March quarter 2012 to June quarter 2026. APN calculation based on Australian Prudential Regulation Authority (Quarterly ADI Property Exposures, Table 1a) and Australian Bureau of Statistics (Lending Indicators, Table 29, A130267691V) data.
The index converts each growth rate into a standard score, its distance from its own 2012–2025 average, and takes the mean of the two. In the June quarter of 2026 land development limits were growing well above their usual pace, while construction commitments, measured against a large quarter a year earlier, were growing more slowly than usual.
| Measure | June quarter 2025 | June quarter 2026 | Change over the year | Standard score of the growth rate |
|---|---|---|---|---|
| Land development limits, all ADIs (end of quarter) | $29.1bn | $36.4bn | 25.2% | +1.5926 |
| New construction loan commitments (in the quarter) | $13.6bn | $13.6bn | 0.1% | −0.3442 |
| APN Development Finance Conditions™ (24460) | +0.6242σ |
Standard scores are each growth rate’s distance from its own 2012–2025 average, in standard deviations; the index is the mean of the two. APN calculation based on Australian Prudential Regulation Authority (Quarterly ADI Property Exposures, June 2026, Table 1a) and Australian Bureau of Statistics (Lending Indicators, June 2026, Table 29, A130267691V) data.
Over 2012–2025 the two growth rates were almost uncorrelated. Construction commitments swing from quarter to quarter, while limits change gradually, so the index can turn sharply in a quarter when commitments swing, as it did between March and June.
Where the reading sits
APN Development Finance Conditions™ (24460) by quarter
Quarterly reading, March quarter 2012 to June quarter 2026. APN Development Finance Conditions™ (24460). APN calculation based on Australian Prudential Regulation Authority and Australian Bureau of Statistics data.
At +0.6242σ, the June quarter reading ranks 73.7 against the 58 quarters since March 2012 in which both measures are complete: higher than 42 of the other 57. The March quarter of 2026 remains the highest reading in the series. The index is one of the components of the APN Future Development Pipeline Index™ (24400), which tracks conditions for delivering new housing.
What this does not show
A credit limit is lenders’ willingness to lend, not money spent on land, and the construction commitments include every kind of construction, not only housing. Neither measure is adjusted for rising costs, so part of the growth reflects higher prices rather than more activity. Finance is one condition for building among several; these figures show that finance for development expanded strongly from the end of 2024, not that more homes will be built as a result.
- Australian Bureau of Statistics (Reference period: June 2026) ‘Table 29. Businesses; Business finance; Fixed term loans; By purpose; New loan commitments; Values’ [data set], Lending Indicators [https://www.abs.gov.au/statistics/economy/finance/lending-indicators/jun-quarter-2026], accessed 30 September 2026.
- Australian Prudential Regulation Authority (Reference period: June 2026) Quarterly authorised deposit-taking institution property exposures, June 2026 (released 17 September 2026) [https://www.apra.gov.au/quarterly-authorised-deposit-taking-institution-property-exposure-statistics-june-2026-highlights], accessed 30 September 2026.
ABS material is used under a Creative Commons Attribution 4.0 International licence. Calculations, standardisations and index readings are APN’s and are not attributable to the ABS.
APRA material is used under a Creative Commons Attribution 3.0 Australia licence. Growth rates, standard scores and index readings are APN’s and are not attributable to APRA.
Findings are presented on the basis of data and evidence alone.
