
Research Preface
This institutional research document is submitted in strict adherence to the governance architecture of the Australian Property Network Codex. It is formally declared that all findings, structural analyses, and causal pathway deductions contained herein are derived from verified Tier-1 institutional data and certified APN Codex node telemetry. No commercial influence, algorithmic bias, or unverified qualitative sentiment has been permitted to alter the foundational empirical baselines. All data figures have been confirmed against sovereign institutional sources including the Reserve Bank of Australia, the Australian Bureau of Statistics, the Australian Prudential Regulation Authority, and sealed APN Codex blueprints prior to publication.
The APN Codex operates upon a strictly enforced, dual-layered intelligence architecture. The 21000 Series serves as the objective data ingestion layer, processing empirical inputs drawn directly from primary sovereign and supranational entities — establishing an immutable mathematical baseline for historical performance and macroeconomic conditions. The 24000 Series acts as the proprietary indices layer, translating these certified empirical baselines into actionable, algorithmically governed structural intelligence frameworks. This definitive separation ensures that raw data artefacts are permanently quarantined from the platform’s proprietary analytical mechanisms.
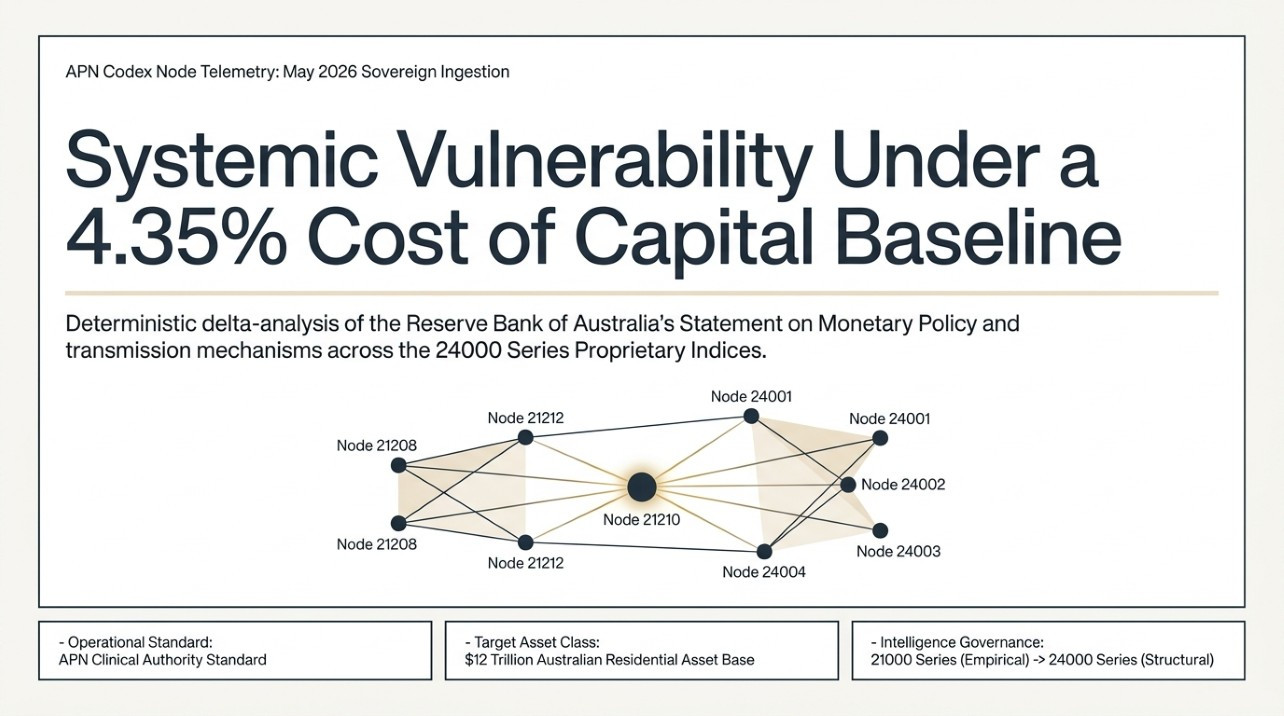
This document executes a deterministic delta-analysis ingestion of the Reserve Bank of Australia’s Statement on Monetary Policy, issued 5 May 2026. The operative nodes are Interest Rates (21210), Banking & Lending Regulation (21350), Inflation (21220), Construction Costs & Supply Chain (21260), Employment & GDP (21230), B2B Invoice Default Velocity (21280), Credit Velocity (21270), and Measured Consumer & Business Sentiment (21640). The central analytical question is how the 25-basis-point OCR adjustment to 4.35%, in conjunction with sustained geopolitical energy disruption and static macroprudential buffers, transmits structural pressure across the APN 24000 Series — specifically the APN Sovereign Policy Composite Index™ (SPCI) (24800), the APN Residual Land Value (RLV) Gap™ (24410), the APN Replacement Cost Gap™ (24450), and the APN Acute Vulnerability Index™ (24126).
1. Executive Telemetry and Strategic Ingestion Overview
The following analysis ingests the Reserve Bank of Australia’s (RBA) Statement on Monetary Policy (SMP), issued on 5 May 2026. The analytical objective is to extract the revised macroeconomic projections, isolate the structural drivers behind the 25-basis-point adjustment to the Official Cash Rate (OCR) to 4.35%, and convert this quantitative and qualitative material into structured data formats compliant with the APN 21000 Series architecture.
Operating under the APN Clinical Authority standard, this report isolates the mathematical framework required to evaluate systemic risk and liquidity friction across the Australian residential asset base, valued in excess of $12 trillion. The resulting analysis identifies the structural pressure points acting upon the proprietary APN 24000 Series indices, mapping the transmission mechanisms by which sovereign monetary adjustments, geopolitical energy frictions, and domestic capacity constraints generate asymmetrical capital allocation and liquidity constraint conditions.
The analysis translates official communications into mathematically verifiable structural observations, bypassing narrative-driven market commentary. By tracking the migration of capital from the regulated ADI sector into the non-bank lending sector, and by measuring the expansion of the APN Replacement Cost Gap™ (24450), the analysis provides a forward-looking framework for near-term demographic displacement and corporate solvency pressure within the construction supply chain.
2. Monetary Conditions and Serviceability Constraints [Node 21210 · Node 21350]
The structural adjustment phase under examination is anchored in the material revision of sovereign monetary policy. The RBA’s decision to increase the OCR target applies an immediate constraint on the cost of capital, altering the mathematical baseline for mortgage assessments across the regulated ADI system.
2.1 Official Cash Rate Variance and Baseline Calibration
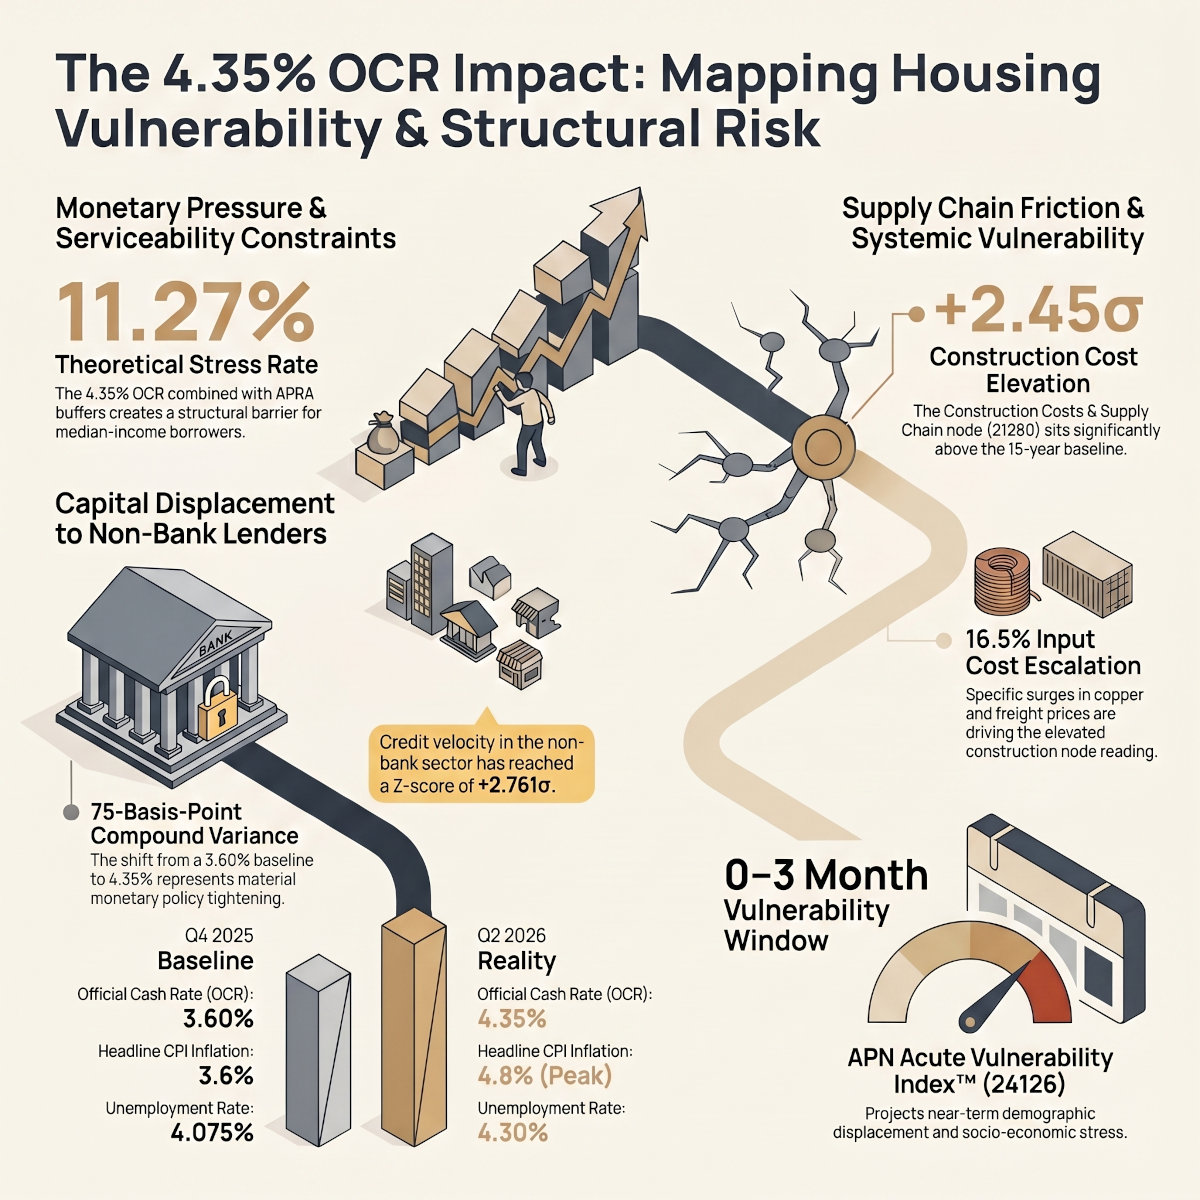
The baseline parameter for Interest Rates (21210), established at the conclusion of the 15-year baseline in Q4 2025, was recorded as a 3.60% cash rate. Prior to the May 2026 adjustment, the operating reality had already shifted to 4.10% following the intervention on 17 March 2026. The 5 May 2026 monetary policy decision further elevated this baseline, generating a cascade of secondary adjustments across the yield curve.
RBA Statement on Monetary Policy, 5 May 2026:
“The Monetary Policy Board decided it was appropriate to increase the cash rate target by 25 basis points to 4.35 per cent.”
The sovereign monetary authority has implemented a 25-basis-point upward adjustment to the baseline cost of capital, setting the new operational threshold at 4.35%. This constitutes a material monetary policy tightening designed to induce a managed economic deceleration and apply a suppressive force on credit velocity.
The shift from the 3.60% baseline to the 4.35% operating reality represents a 75-basis-point compound variance across a two-quarter observation window. The most recent certified Node 21210 reading is +1.0049σ (Q1 2026) — a meaningfully elevated but historically unexceptional cost-of-capital environment relative to the 15-year mean; the June quarter, which carries the 4.35% cash rate, has not yet been certified. This positions the cost of capital as a sustained structural pressure point across all forward-looking asset valuation models.
2.2 APRA Serviceability Buffers and the Regulatory Borrowing Capacity Index
Note, September 2026: Banking & Lending Regulation (21350) now records APRA’s lending rules as a register and no longer publishes a standardised reading. The index and the −1.4085σ reading described in this section were its certified method and reading at the date of publication.
The reduction in theoretical borrowing capacity cannot be quantified using the OCR in isolation; it must be mapped against Banking & Lending Regulation (21350). This node operates under a Step-Function Carry-Forward Protocol, utilising the Regulatory Borrowing Capacity Index (RBCI_t) to measure the continuous financial constraint imposed by macroprudential policy.
The RBCI_t isolates the regulatory contribution to capacity reduction from market interest rate effects:
RBCI(t) = B(reg,t) ÷ B(base)
where B_{base} is the historical Q1 2011 baseline buffer of 2.0 percentage points, and B_t^{reg} is the current mandated buffer in force at the time of observation.
The regulatory history of the ADI serviceability buffer across the 15-year baseline defines three distinct epochs:
- Epoch 1 (Q1 2011 – Q2 2019): Baseline buffer of +2.0 percentage points. RBCI_t = 1.0000.
- Epoch 2 (Q3 2019 – Q3 2021): Moderate constraint environment, +2.5 percentage point buffer. RBCI_t = 0.8000.
- Epoch 3 (Q4 2021 – Q4 2025): Material constraint environment, +3.0 percentage point buffer. RBCI_t = 0.6667.
Certified population statistics for Banking & Lending Regulation (21350), drawn from N=60 quarterly observations, establish a population mean (\mu) of 0.8756 and a population standard deviation (\sigma) of 0.1483. Applying the standard Z-score equation:
Z(21350,t) = (RBCI(t) − μ) ÷ σ
The Q4 2025 Z-score calculates to −1.4085σ, confirming that the current macroprudential architecture suppresses borrowing capacity materially below the 15-year historical mean. A post-baseline constraint activated in February 2026 layered an additional restriction via a 20% cap on new lending to borrowers with debt-to-income (DTI) ratios ≥ 6x, compounding the restrictive conditions prior to the May OCR adjustment.
2.3 The Credit Exclusion Mechanism and Theoretical Stress Rates
The Serviceability Trap is a mathematically defined construct within the APN framework, quantifying how the convergence of elevated asset prices, static serviceability buffers, and constrained financing costs restricts entire cohorts of creditworthy borrowers from active market participation.
Under the previous 4.10% OCR operating reality recorded in March 2026, the structural drift analysis established that theoretical stress rates for ADIs were approaching 11.02%. The calculation isolates the constituent components of the assessment rate: the official cash rate, the institutional margin applied by the retail banking sector, and the macroprudential buffer mandated by APRA.
Given an 11.02% theoretical stress rate under a 4.10% OCR and a static 3.0% APRA buffer (Epoch 3 RBCI_t), the institutional margin is mathematically isolated at 3.92%:
4.10% + 3.92% + 3.00% = 11.02%
Applying this framework to the 5 May 2026 adjustment to a 4.35% OCR:
Stress Rate (Q2 2026) = 4.35% + 3.92% + 3.00% = 11.27%
Stress Rate = OCR + Institutional Margin + APRA Buffer
This theoretical assessment threshold of 11.27% operates as a structural exclusionary boundary within the regulated ADI system. An 11.27% assessment rate materially reduces the aggregate borrowing capacity of low-to-median income cohorts, generating an affordability constraint that suppresses transactional liquidity at the lower and middle tiers of the asset base.
2.4 Capital Displacement Dynamics and the Non-Bank Lending Sector [Node 21270]
As the mathematical baseline for mortgage assessments adjusts upward, the suppressive force applied to the regulated ADI ecosystem generates an asymmetrical capital allocation response. The 11.27% stress rate boundary functions as a structural rejection mechanism, displacing capital demand from the regulated primary tiers of the financial system.
This structural pressure directly feeds the telemetry of Credit Velocity (21270). The analysis confirms a displacement of capital from the ADI system into non-bank lending sector channels.
During the terminal period of the 15-year baseline (Q4 2025), Credit Velocity (21270) indicated that the non-bank lending sector was operating at moderately elevated levels, with a certified Z-score of +0.7701σ (Q4 2025). The sector’s baseline function as a secondary funding channel has transitioned materially toward a primary funding corridor for cohorts excluded by macroprudential parameters.
The implementation of the 4.35% OCR, combined with the static RBCI_t constraint and the DTI limits introduced in February 2026, is projected to accelerate this displacement. As ADI credit velocity contracts further, the non-bank lending sector is required to absorb the displaced demand, increasing the cost of capital for affected borrowers and concentrating risk outside the direct APRA supervisory perimeter.
3. Inflationary Architecture and Supply-Side Multipliers [Node 21220 · Node 21260]
The RBA’s justification for the 25-basis-point OCR adjustment is anchored in the persistence of inflationary conditions. The analysis of Inflation (21220) and Construction Costs & Supply Chain (21260) identifies the supply-side multipliers sustaining these conditions and confirms that the disinflationary trajectory has stalled.
3.1 Trimmed Mean Trajectory and Forecast Tabulation
The certified reading for Inflation (21220) at the end of 2025 was +1.5379σ (Q4 2025); the node’s current certified reading is +2.1049σ (Q2 2026). The operating reality entering Q2 2026 recorded headline inflation at 3.7% in February before rising to 4.6% in March. The RBA has materially revised its macroeconomic projections across the forward estimates.
RBA Statement on Monetary Policy, 5 May 2026:
“The Board assessed that inflation is likely to remain above target for some time and that the risks remain tilted to the upside, including to inflation expectations.”
The structural inefficiency within the pricing architecture is assessed as persistent, necessitating an upward revision of the inflation trajectory. The risk parameters exhibit an asymmetrical probability distribution weighted toward sustained above-target conditions.
The following table extracts the structured projections comparing the previous February 2026 baseline against the revised May 2026 operating reality:
| Economic Indicator | Dec 2025 (Actual) | Jun 2026 (Revised) | Dec 2026 (Revised) | Jun 2027 (Revised) | Dec 2027 (Revised) | Jun 2028 (Revised) |
| Headline CPI Inflation | 3.6% | 4.8% (Prev: 4.2%) | 4.0% (Prev: 3.6%) | 2.4% (Prev: 2.9%) | 2.4% (Prev: 2.7%) | 2.5% (Prev: 2.6%) |
| Trimmed Mean Inflation | 3.4% | 3.8% (Prev: 3.7%) | 3.5% (Prev: 3.2%) | 3.1% (Prev: 2.8%) | 2.6% (Prev: 2.7%) | 2.5% (Prev: 2.6%) |
3.2 Duration of Target Band Overshoot
The RBA’s mandated inflation target band sits between 2.0% and 3.0%. The revised trajectory for Trimmed Mean inflation projects a path of 3.8% (June 2026), declining to 3.5% (December 2026) and 3.1% (June 2027), before returning within the band at 2.6% in December 2027.
This trajectory maps a target band overshoot extending six additional quarters from the current operating reality (Q2 2026 through Q4 2027). The persistence of this overshoot is projected to sustain purchasing power erosion, with non-discretionary holding costs progressively decoupling from baseline wage growth. The necessity to maintain the OCR at elevated levels throughout this period ensures that monetary policy constraint will apply continuously across the macroeconomic timeline, compounding the serviceability pressure identified in Interest Rates (21210).
3.3 Geopolitical Energy Friction and Specific Inflationary Weighting
A primary structural driver of the upward CPI revision is the geopolitical energy disruption originating in the Middle East. The RBA explicitly attributes a concentrated inflationary weighting to the resulting disruption to global energy and shipping systems.
RBA Statement on Monetary Policy, 5 May 2026:
“The conflict in the Middle East has severely disrupted energy production and shipping in the region… In Australia, headline inflation increased to 4.6 per cent in March, with the higher fuel prices contributing 0.8 percentage points.”
A material adverse event in the Middle East has generated structural disruptions across global energy and logistics networks. This dislocation applied a direct 0.8 percentage point (80 basis point) inflationary load to the domestic pricing architecture in March 2026.
The 80-basis-point weighting attributed to global energy price escalation confirms that external supply shocks are materially distorting domestic monetary conditions. Analysis of underlying commodity markets indicates the scale of this external pressure. The headline Brent crude oil price rose by approximately 66% following an estimated decline in global oil production of approximately 10 million barrels per day (World Bank Commodity Markets Outlook, April 2026). The April 2026 operating reality recorded Brent crude at approximately US$105/bbl.
The central bank further notes the structural transmission of these primary cost shocks:
RBA Statement on Monetary Policy, 5 May 2026:
“Higher fuel prices are adding to inflation and there are indications that this is likely to have second-round effects on prices for goods and services more broadly… The full effects of higher fuel costs on underlying inflation will take time to materialise as they typically pass through to other goods and services prices gradually.”
The primary input cost shock is propagating through the broader economy via secondary structural channels. Elevated transport, freight, and production costs are in the process of embedding across the pricing matrix, generating a sustained upward drift in the baseline cost of operations.
3.4 Construction Input Escalation and the APN Replacement Cost Gap™ (24450)
The secondary inflationary vectors triggered by energy disruption exert a disproportionate escalation on physical asset delivery costs, tracked within Construction Costs & Supply Chain (21260). The certified reading for this node is +1.3708σ (Q1 2026), recertified on a repaired insolvency input; it is higher than first published because the node now reads on all three of its components, not because construction conditions deteriorated. In early 2026, the US$105/bbl energy multiplier contributed to a 16.5% material escalation in copper and freight costs.
This escalation in the cost of physically delivering supply feeds directly into the APN Replacement Cost Gap™ (24450).
The APN Replacement Cost Gap™ (24450) measures the structural divergence between the capital required to construct a new physical asset and the current market valuation of an equivalent existing property. As the 16.5% escalation in material inputs expands the cost of new construction, the gap between new supply costs and existing asset valuations widens. Because it is not financially viable to deliver new affordable supply under these elevated cost conditions — the project fails the residual land value gap test monitored by the APN Residual Land Value (RLV) Gap™ (24410) — the volume of financially feasible new supply contracts. This mathematical expansion of the Replacement Cost Gap establishes a structural price floor that insulates incumbent asset holders from downward valuation pressure, as established properties retain a cost advantage relative to new construction under current input conditions. When construction costs materially exceed projected end-valuations, the supply pipeline undergoes structural attrition, generating a scarcity condition that partially offsets the suppressive forces of the 11.27% serviceability constraint.
4. Capacity Pressures and Supply Chain Solvency [Node 21230 · Node 21280]
The RBA’s justification for monetary tightening explicitly references domestic utilisation conditions beyond isolated inflation. These capacity constraints interface directly with corporate solvency metrics within the APN architecture, detailing how cost pressure transmits from the macroeconomic environment into localised supply chains.
4.1 Labour Market Conditions and Utilisation
The baseline parameter for Employment & GDP (21230) at the end of 2025 recorded an unemployment rate of 4.09% (December 2025). By March 2026, the operating reality had moved to 4.3%. Underlying metrics indicate limited elasticity within the labour market. The employment-to-population ratio remained at 64.0%, and the underemployment rate held at 5.9%.
RBA Statement on Monetary Policy, 5 May 2026:
“The labour market has evolved broadly as expected and conditions remain somewhat tight relative to full employment… capacity pressures in the Australian economy remain elevated.”
The institutional data confirms that human capital utilisation metrics continue to operate near systemic capacity. The persistence of these conditions indicates a labour market that is structurally constrained from expanding output without generating further wage-price pressure.
Model-based estimates of the non-accelerating inflation rate of unemployment (NAIRU) indicate a tighter labour market than top-line metrics suggest, pointing to ongoing capacity pressures. The revised macroeconomic projections forecast a managed deceleration, with unemployment modelled at 4.4% by December 2026, 4.6% by December 2027, and 4.7% by June 2028.
Concurrently, GDP growth is projected to remain below potential, recording 1.3% through late 2026 and 2027, before edging to 1.4% in 2028. Within the APN framework, this trajectory reflects a structural condition in which aggregate headcount stability masks an underlying compositional shift from secure full-time employment toward part-time labour roles. This compositional shift further erodes the aggregate debt-servicing capacity of the workforce, compounding the exclusions quantified by RBCI_t.
4.2 The Margin Contraction Vector
The convergence of tight labour market conditions (Employment & GDP (21230)), elevated borrowing and holding costs (Interest Rates (21210)), and the 16.5% escalation in material inputs (Construction Costs & Supply Chain (21260)) establishes a compounding margin contraction condition across the construction supply chain.
Builders, subcontractors, and developers operating under fixed-price contracts are structurally constrained from absorbing the non-linear escalation in copper, freight, and energy inputs, and cannot offset these costs through productivity gains given existing labour market capacity conditions. As the APN Replacement Cost Gap™ (24450) expands, the capital required to deliver previously contracted supply progressively exceeds the gross revenue secured at project inception, eroding fixed-price margins.
4.3 B2B Invoice Default Velocity and Pipeline Attrition [Node 21280]
The structural consequence of this margin contraction condition is quantified by B2B Invoice Default Velocity (21280), which operates within the APN Codex as the primary corporate solvency indicator for the construction sector.
B2B Invoice Default Velocity (21280) monitors high-frequency conditions within the localised construction supply chain, tracking the frequency of material payment delays, major term extensions, and subcontractor default rates.
The current operating reality confirms a direct transmission mechanism: the sustained pressure of an 11.27% theoretical stress rate combined with the 16.5% input escalation is driving an elevated rate of corporate voluntary liquidations and sustained capital constraint across the sector.
RBA Statement on Monetary Policy, 5 May 2026:
“Uncertainty surrounding the conflict has made global financial markets more volatile… If uncertainty becomes particularly high, households and businesses could cut their spending by much more, which would mitigate some of the increase in inflation but lead to a higher unemployment rate.”
Elevated market volatility and risk perception are inducing a structural contraction in investment deployment. This risk-aversion response is projected to generate a material reduction in forward capital allocation across the construction sector.
As B2B Invoice Default Velocity (21280) registers an elevated frequency of subcontractor defaults and payment delays, it operates as a leading indicator for developer insolvency. Under standard APN protocols, this intelligence triggers downward adjustments to assumed New Housing Supply Forecasts (21520). The resulting pipeline attrition indicates that future physical supply will face material difficulty in meeting baseline demographic demand.
5. Structured Output and APN Codex Ingestion Variables
In accordance with APN governance protocols, the qualitative assessments and raw statistics derived from the 5 May 2026 RBA Statement on Monetary Policy are distilled into structured data outputs to govern the 24000 Series proprietary indices.
5.1 Revised Q2 2026 Base Parameters
| Codex Node | Dimension | Q4 2025 Baseline | Q2 2026 Operating Reality | Clinical Delta Impact |
| Interest Rates (21210) | OCR | 3.60% | 4.35% (May 2026) | Material constraint. Forces theoretical stress rates to 11.27%; accelerates non-bank sector capital displacement. |
| Inflation (21220) | Headline CPI | +1.5379σ | 4.80% (Mid-2026 peak) | Purchasing power erosion. Decouples holding costs from wage growth; extends target overshoot to Q4 2027. |
| Construction Costs & Supply Chain (21260) | Input Costs | +1.3708σ | US$105/bbl Brent (approx.) | Elevated input costs. Contributes to material cost increase; widens APN Replacement Cost Gap™ (24450). |
| Employment & GDP (21230) | Unemployment | 4.09% (December 2025) | 4.30% (Mar 2026) | Compositional shift. Precursor to broader serviceability degradation and capacity utilisation limits. |
| Measured Consumer & Business Sentiment (21640) | Composite | −0.0445σ | 91.6 Index (Mar 2026) | Subdued sentiment. Westpac-Melbourne Institute reading of 91.6 confirms sustained pessimism below the neutral 100 mark. |
5.2 Sovereign Friction Coefficient Formulation [Node 24800]
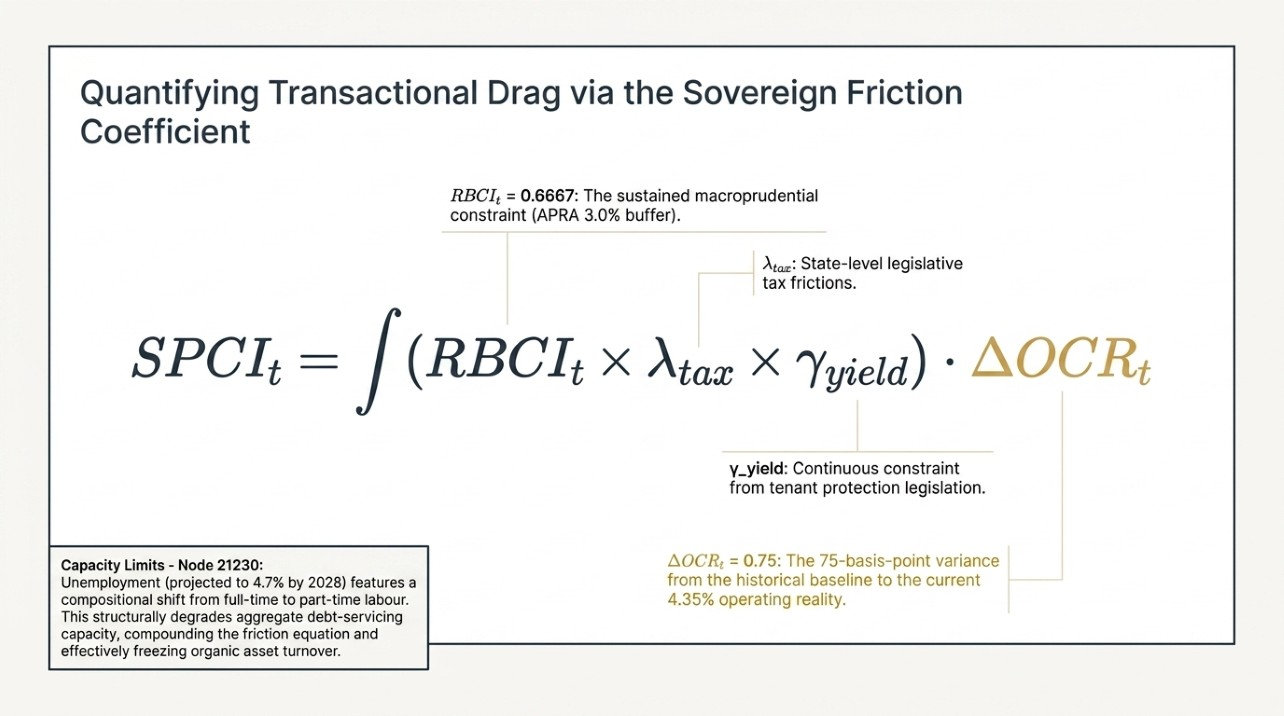
The APN Sovereign Policy Composite Index™ (SPCI) (24800) is a master macroeconomic composite that aggregates and weighs the net impact of all state-level market interventions nationwide, providing a definitive measure of how sovereign regulatory architecture shapes asset trajectories, market liquidity, and capital fluidity.
The Sovereign Friction Coefficient resulting from the May 2026 monetary adjustment integrates the RBCI_t from Banking & Lending Regulation (21350) with localised friction variables:
SPCI_t = \int (RBCI_t \times \lambda_{tax} \times \gamma_{yield}) \cdot \Delta OCR_t
Where:
- RBCI_t = 0.6667 (the sustained macroprudential constraint at Q4 2025)
- \lambda_{tax} represents state tax frictions derived from Node 21120
- \gamma_{yield} represents structural yield friction derived from the continuous constraint index of tenant protections modelled in Node 21370
- \Delta OCR_t = 0.75% (the 75-basis-point variance from the 3.60% baseline to the 4.35% operating reality)
This coefficient represents the cumulative downward pressure applied to market transactional velocity. The combination of an 11.27% serviceability assessment rate with state-level legislative constraints and yield frictions establishes an elevated Sovereign Friction Coefficient, confirming that the existing regulatory architecture is applying a material drag on organic asset turnover.
5.3 Causal Convergence: Acute Vulnerability Index™ (24126)
The structural pressure generated by the 21000 Series nodes feeds directly into the APN Social Capital Index™ (24100), specifically targeting the APN Acute Vulnerability Index™ (24126). This index is the primary quantitative indicator for systemic demographic displacement, measuring concentrated markers of localised socio-economic stress and housing insecurity.
Based on the verified 2026 Causal Pathway Matrix, the net pressure direction and manifestation data for the APN Acute Vulnerability Index™ (24126) are defined as follows:
Net Pressure Direction: ↓ Material
Lag-to-Manifestation: 0–3 months
The APN Acute Vulnerability Index™ (24126) is the sub-node within the 24100 branch where all five active Delta-Analysis pressure points converge simultaneously. The telemetry generated by the 5 May 2026 RBA adjustments positions the following nodes as direct, primary causal inputs:
- Interest Rates (21210): The 4.35% OCR and the resulting 11.27% stress rate structurally exclude median cohorts from market participation.
- Inflation (21220): The 4.8% peak CPI and sustained target overshoot to Q4 2027 continuously erode real household disposable income.
- Employment & GDP (21230): Rising unemployment projections (to 4.7%) and the compositional shift in employment degrade baseline serviceability across the workforce.
- Construction Costs & Supply Chain (21260): Margin contraction and pipeline attrition suppress the delivery of affordable supply.
- Measured Consumer & Business Sentiment (21640): The Westpac-Melbourne Institute Consumer Sentiment Index reading of 91.6 (March 2026) confirms sustained pessimism below the neutral 100 mark, reflecting elevated market risk perception.
The 0–3 month lag-to-manifestation establishes the APN Acute Vulnerability Index™ (24126) as the most analytically significant concentration of structural risk in the current operating environment.
These five active inputs overlay the primary triple-input pathway: rental market conditions (21190), population growth velocity against supply capacity (21410), and household formation trends (21430). The convergence of these conditions projects material systemic demographic displacement in Q3 2026, with structural realignment of population distributions across major metropolitan corridors a likely consequence.
6. Synthesis of Structural Pressure Points
The ingestion of the 5 May 2026 RBA Statement on Monetary Policy provides empirical confirmation of a material escalation in systemic constraints across the macroeconomic architecture.
The 25-basis-point upward adjustment to the OCR (4.35%) operates as a compound multiplier across the Codex. When synthesised through the APN framework, this monetary adjustment interacts with static macroprudential buffers (RBCI_t = 0.6667) to generate a theoretical stress rate boundary of 11.27%. This structural threshold excludes material segments of median-income cohorts from the regulated ADI system, generating a measurable displacement of capital into the non-bank lending sector (Credit Velocity (21270)). This migration increases the cost of capital for affected borrowers and concentrates risk outside the APRA supervisory perimeter.
Concurrently, geopolitical energy disruptions have applied an 80-basis-point specific weighting to domestic headline inflation, establishing secondary vectors that are contributing to a 16.5% escalation in physical material inputs. This non-linear escalation expands the APN Replacement Cost Gap™ (24450), rendering fixed-price building contracts financially constrained. The downstream effect registers in B2B Invoice Default Velocity (21280) as corporate voluntary liquidations increase, eroding builder margins and generating pipeline attrition. This attrition simultaneously insulates incumbent asset holders by establishing a structural cost floor beneath established residential properties.
The convergence of monetary constraint, stalled disinflation, pipeline attrition, and capacity limits concentrates material, near-acting (0–3 months) downward pressure on the APN Acute Vulnerability Index™ (24126). The 2026 operating reality indicates that the sovereign regulatory architecture will continue to apply downward pressure on transactional liquidity, elevate sovereign friction across the APN Sovereign Policy Composite Index™ (SPCI) (24800), and generate near-term demographic displacement conditions.
Delta-Analysis Update: RBA SMP Q2 2026
