
Fractured Foundations: Why Australia’s Housing Targets Are Mathematically Unachievable
Restrictive monetary policy has widened the gap between what land vendors expect and what developers can mathematically afford to pay, driving a 24.5% monthly collapse in multi-unit building approvals. This brief applies APN’s proprietary development-pipeline indices to test whether the National Housing Accord’s target of 1.2 million new homes remains achievable.
Australian Property Network (APN) is an independent property intelligence platform. It carries no commercial affiliations, accepts no advertising revenue, and maintains no relationships with real estate industry bodies, developers, or financial institutions. Its sole purpose is to provide honest, evidence-based analysis of the Australian property market, a domain where commercially conflicted voices predominate and genuinely independent research is scarce.
The analytical foundation of APN is the APN Codex, a structured framework that assigns discrete numbered nodes to every relevant domain of property and macroeconomic knowledge. Two-node series are operative in this report. The 21000 Series comprises objective data inputs drawn exclusively from authoritative official sources, including the Reserve Bank of Australia, the Australian Bureau of Statistics, APRA, and ASIC. The 24000 Series comprises APN’s proprietary indices, analytical constructs derived from official data through APN’s own research methodology.
This report applies the 21300 Legislation & Policy Analysis node and the 24400 APN Future Development Pipeline Index™ to empirically test whether restrictive monetary conditions have rendered state-mandated housing targets mathematically unachievable. Findings are presented as the data dictates, not as any commercial interest would prefer them to be.
This analysis tests the hypothesis that restrictive monetary cycles systematically suppress high-density construction feasibility, rendering state-mandated housing targets mathematically constrained. Government housing targets are policy constructs, whereas structural bottlenecks — specifically the Residual Land Value (RLV) Gap — determine true delivery reality.
Future Dev Pipeline
A supply-side filter separating paper rezonings from genuinely deliverable projects.
APN RLV Gap™
The spread between land value and total development cost, inclusive of required margin.
Replacement Cost Gap
The divergence between current replacement construction cost and achievable market value.
Empirical Anchor: Multi-Unit vs Detached Approvals
ABS 8731.0 — Dwellings Excluding Houses, seasonally adjusted, Feb 2025 – Jan 2026
Baseline Context: Housing Accord Trajectory Deficit
Five-year average and current run rate against the 240,000-a-year Accord target
Financial Fracture: Impact of the 4.10% Cash Rate on Feasibility
Residual Land Value Gap, baseline (2.0% cash rate) vs current (4.10% cash rate)
Testing for Supply-Side Resilience
Checking whether detached-housing growth or a construction-insolvency plateau offsets the multi-unit collapse
The primary objective of this research is to empirically test the hypothesis that restrictive monetary cycles systematically suppress high-density construction feasibility, rendering state-mandated housing targets mathematically unachievable. This report applies the 21300 Legislation & Policy Analysis framework to evaluate the intersection of sovereign mandates and private sector execution capacity.
The baseline macro-thesis posits that government housing targets are fundamentally policy constructs. While these targets represent administrative ambition, the physical delivery of residential supply is governed entirely by mathematical constraints and structural bottlenecks. To quantify these constraints, this analysis focuses on the 24400 APN Future Development Pipeline Index™.
The 24400 APN Future Development Pipeline Index™ is a supply-side filter that separates theoretical paper rezonings from genuinely deliverable, shovel-ready projects. It functions as an economic viability overlay, distinguishing between sovereign planning ambition and commercial execution probability. The 24400 index comprises five critical sub-indices:
- 24410 APN Residual Land Value (RLV) Gap™: The spread between land value and total development cost, inclusive of required developer margin.
- 24420 APN Infrastructure Uplift Multiplier™ (APN IUM™): The cost and delay burden imposed by infrastructure constraints on project feasibility.
- 24430 APN Supply Chain Strain Index™: A measure of materials, labour, and logistics friction in the construction pipeline.
- 24440 APN Social Licence & Objection Velocity™: The rate and intensity of community and regulatory resistance to new approvals.
- 24450 APN Replacement Cost Gap™: The divergence between replacement construction cost and achievable market value.
Through the rigorous application of these analytical constructs, this report examines four areas in turn: the empirical anchor of current building approvals, the baseline context of historical supply relative to the National Housing Accord, the financial fracture caused by monetary policy, and the counter-evidence for potential supply-side resilience.
The foundational metric for forecasting near-term physical housing supply is the volume of statutory building approvals. Approvals function as the ultimate leading indicator for future commencements and completions, representing the aggregate intent and financial capacity of the private sector to initiate new supply. To establish the explicit statistical movement in high-density dwelling approvals, primary source data from the Australian Bureau of Statistics (ABS) 8731.0 Building Approvals series for January 2026 has been analysed.
Seasonally Adjusted Approval Contraction
The seasonally adjusted estimate for total dwelling units approved across Australia recorded a material decline of 7.2% month-on-month in January 2026, dropping to an aggregate volume of 14,564 units. This negative movement follows a severe 14.9% decline recorded in December 2025. Over a broader temporal horizon, the total dwelling approval volume for January 2026 represents a 15.7% year-on-year contraction compared to January 2025.
However, the aggregate headline decline obscures a profound structural bifurcation between low-density and high-density asset classes. The reduction was disproportionately driven by an acute contraction in the multi-unit sector. The specific metric for this sector, private sector dwellings excluding houses, fell by 24.5% month-on-month in January 2026, registering an approval volume of just 4,393 units.
This 24.5% monthly decline is not an isolated anomaly. It follows a similarly steep 30.7% contraction in December 2025. The compounding effect is starkly illustrated in the annualised data, which reveals that private sector dwellings excluding houses have contracted by a severe 44.2% year-on-year.
| Approval Category (Seasonally Adjusted) | January 2026 Volume | Month-on-Month Change | Year-on-Year Change |
|---|---|---|---|
| Total Dwelling Units Approved | 14,564 | -7.2% | -15.7% |
| Private Sector Houses | 9,753 | +1.1% | +7.1% |
| Private Sector Dwellings Excluding Houses | 4,393 | -24.5% | -44.2% |
Table 1: Australian Building Approvals, January 2026. Data sourced from ABS 8731.0.
Conversely, the data indicates that private sector house approvals exhibited marginal resilience, rising by 1.1% month-on-month to reach 9,753 units, which translates to a 7.1% increase compared to the previous year. This divergence suggests that while the operational capacity for delivering detached dwellings remains relatively stable, the systemic parameters required to facilitate high-density, multi-unit construction have fractured.
Trend Series Smoothing and Geographic Dislocation
While seasonally adjusted monthly figures provide a real-time assessment of market velocity, they are inherently volatile. To mitigate this, the ABS 12-month trend series is utilised as a more stable indicator of underlying market momentum.
The trend estimate for total dwelling units approved in January 2026 sat at 16,386 units, a negligible 0.1% month-on-month decline, yet maintaining a 6.0% year-on-year elevation. Within this smoothed trend, private sector dwellings excluding houses recorded 6,362 approvals for the month. This represents a 1.1% month-on-month decline within the trend parameters, though it retains a 6.2% increase compared to the previous year. While the trend series presents a less acute contraction, an absolute trend volume of 6,362 monthly multi-unit approvals is structurally incompatible with the high-density requirements of sovereign housing mandates.
Geographic dislocation is also a prominent feature. In January 2026, the contraction in building permits was concentrated across the major eastern seaboard markets, with declines in New South Wales (-5.1%), Victoria (-11.0%), and Queensland (-6.0%), alongside a drop in South Australia (-9.3%). In stark contrast, peripheral markets such as Western Australia and Tasmania posted notable gains of 13.7% and 14.1% respectively. This indicates that the collapse in high-density development feasibility is most severe in the primary population centres, precisely where it is most critical.
To evaluate the feasibility of state-mandated housing targets, the 21300 Legislation & Policy Analysis lens dictates that sovereign policy ambitions must be measured against objective, historical supply execution rates. The prevailing macro-policy framework is the National Housing Accord.
The National Housing Accord Trajectory
The National Housing Accord is an ambitious agreement between federal, state, and local governments, institutional investors, and the construction sector. Its central mandate is the delivery of 1.2 million new, well-located homes over five years, from July 2024 to mid-2029.
To achieve this, the sector must maintain an operational run rate of 240,000 dwelling completions annually, or 20,000 per month. Because completions are the final stage, the volume of statutory building approvals must mathematically meet or exceed this 240,000 annual threshold to account for project attrition. Therefore, an approval rate of 240,000 per annum is the absolute minimum baseline required.
Historical Capacity and the Mathematical Deficit
An analysis of ABS annual building approval data over the preceding five years (2021-2025) establishes the sector’s maximum proven operational capacity.
| Calendar Year | Total Dwelling Units Approved | Variance from 240,000 Target | Percentage Deficit |
|---|---|---|---|
| 2021 | 227,261 | -12,739 | -5.3% |
| 2022 | 192,409 | -47,591 | -19.8% |
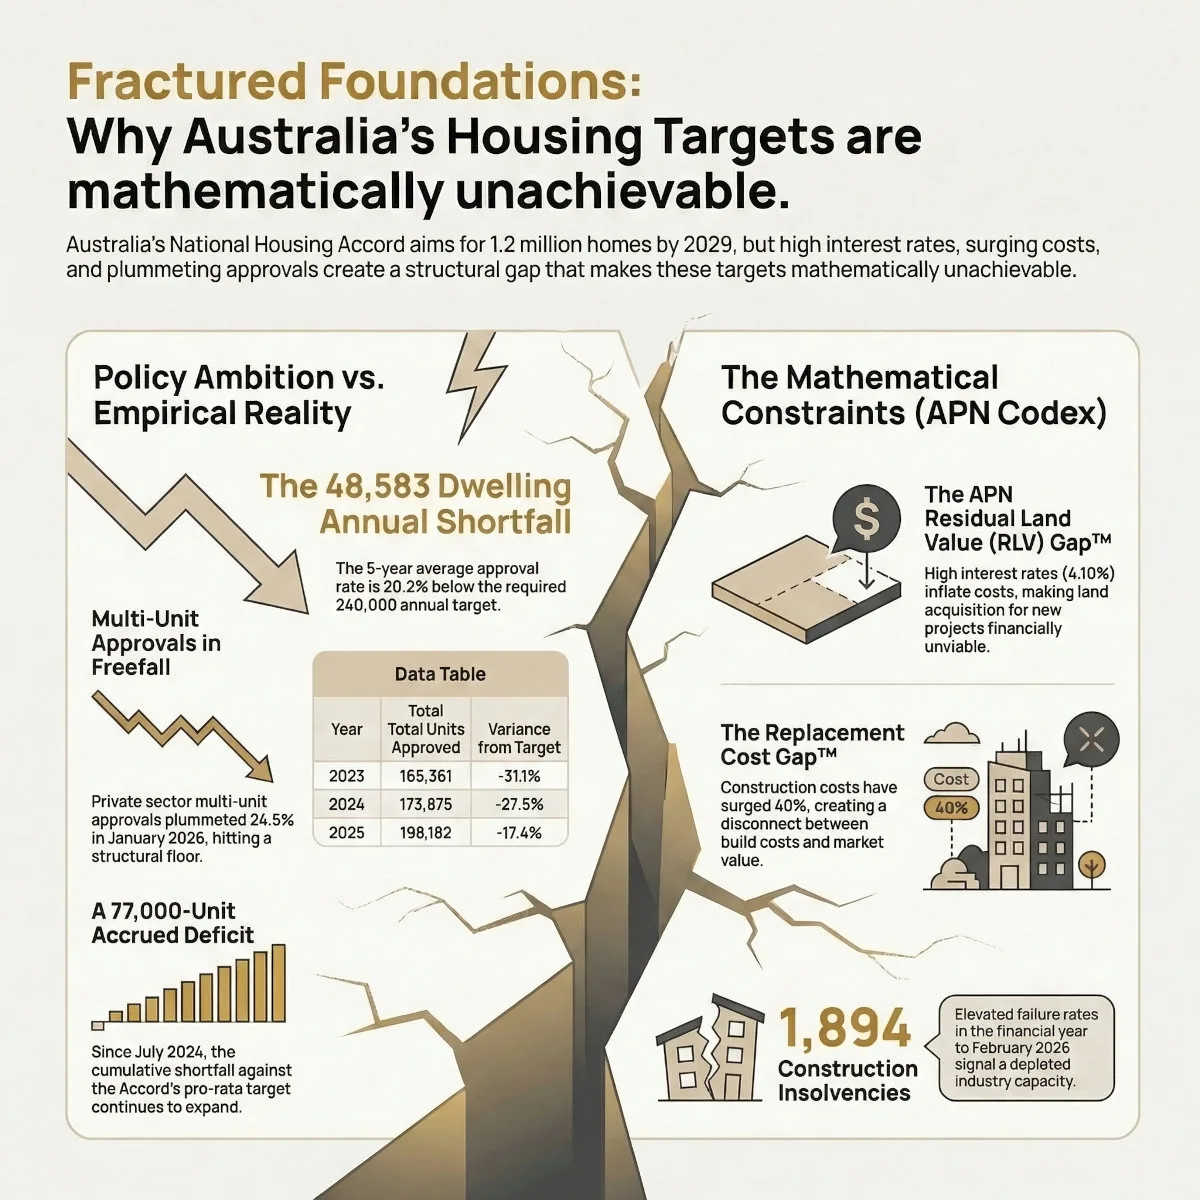
| 2023 | 165,361 | -74,639 | -31.1% |
| 2024 | 173,875 | -66,125 | -27.5% |
| 2025 | 198,182 | -41,818 | -17.4% |
| 5-Year Average | 191,417 | -48,583 | -20.2% |
Table 2: Historical Building Approvals (2021-2025) vs. National Housing Accord Target. Data sourced from ABS 8731.0 derived annual totals.
The historical data demonstrates unequivocally that the Australian residential construction sector has not achieved 240,000 annual approvals in the preceding five years. Even during the peak stimulus cycle of 2021, total approvals peaked at 227,261 units. The five-year historical average of 191,417 annual approvals reveals an absolute annual shortfall of 48,583 dwellings, operating 20.2% below the required run rate.
Forward Deficit Projections and Capacity Ceilings
Current forward indicators suggest a structural deterioration. The January 2026 approval figure of 14,564 is 27.1% below the strict 20,000 monthly target. Analysis indicates that from the Accord’s commencement in July 2024 to early 2026, a cumulative shortfall of over 77,000 units has already accrued against the pro-rata target.
This is corroborated by independent economic modelling, which determined a structural supply ceiling of approximately 180,000 to 195,000 annual completions. The study concluded that even under optimistic scenarios, the sector will likely achieve 880,000 to 920,000 dwellings over the Accord period, a 23% to 27% shortfall. This confirms that demand-side policies cannot overcome supply-side structural limits.
The core hypothesis is that the shortfall in high-density construction is a systematic mathematical fracture driven by restrictive monetary cycles. This is quantified using the 24400 APN Future Development Pipeline Index™.
In early 2026, the Reserve Bank of Australia (RBA) increased the official cash rate to 4.10%. This tightening fundamentally alters capital stack parameters for developers, exerting severe downward pressure on high-density project feasibility.
The Expansion of the 24410 APN Residual Land Value (RLV) Gap™
The most critical mechanism is the 24410 APN Residual Land Value (RLV) Gap™, the spread between a land vendor’s price expectations and a developer’s mathematical capacity to pay. The RLV is calculated by taking the Gross Realisation Value and subtracting Total Development Cost and the developer’s required profit margin.
The 4.10% cash rate environment drastically inflates costs, causing the RLV Gap to expand and freezing the transaction market for high-density sites. This is driven by three frictions:
- Elevated Financing Costs: With a 4.10% cash rate, senior development finance can exceed 8-10%, aggressively eroding the residual capital available for land acquisition.
- Amplified Holding Costs: Protracted planning and approval timelines become financially punitive when the cost of capital is high, degrading project profitability.
- Non-Negotiable Margins: Developers require a standard 20% margin on cost. As costs increase, the absolute dollar value of the required profit also increases.
When financing costs and required margins escalate, the mathematically derived RLV drops precipitously. However, land vendors remain anchored to historical peak valuations. This divergence is the 24410 APN RLV Gap™. Feasibility modelling confirms the baseline RLV Gap is already precariously narrow and, in many high-density corridors, actively negative.
The Implementation of the 24450 APN Replacement Cost Gap™
Compounding the RLV fracture is the 24450 APN Replacement Cost Gap™, the divergence between replacement construction cost and the achievable market value of the completed asset. For construction to commence, the end-market value must significantly exceed the replacement cost.
However, a historical surge in construction input costs, escalating by approximately 40% over the past five years, has created a profound disconnect. Because the cost to build a new high-density unit heavily exceeds the cost of an equivalent existing unit, developers cannot raise off-the-plan prices sufficiently to cover their costs without alienating buyers. The 24450 APN Replacement Cost Gap™ dictates an impasse: until established property values rise substantially or construction costs deflate, institutional capital will remain on the sidelines.
Frictions in Infrastructure and Supply Chains
The pipeline is further suppressed by physical and logistical variables measured by two additional indices:
- 24420 APN Infrastructure Uplift Multiplier™ (APN IUM™): This measures the cost and delay burden from infrastructure constraints. Legacy municipal infrastructure often lacks the capacity for density spikes, and the cost of upgrades is increasingly levied on developers, eroding the RLV.
- 24430 APN Supply Chain Strain Index™: This measures friction from materials, labour, and logistics. Acute labour shortages (up to 279,000 vacancies) and extended build times (up to 80% longer) convert time directly into a compounding debt multiplier, penalising complex high-density projects.
To maintain analytical neutrality, this report must test for evidence of supply-side resilience. Two primary counter-narratives exist: the potential stabilisation of construction insolvencies and the scaling capacity of the detached housing market.
Insolvency Stabilisation vs. Structural Burn Rate
A counter-argument relies on early indicators of a plateau in corporate insolvencies. ASIC data for Q1 2025-26 showed a slight 2.1% decline in administrations from the prior year. However, this decline is a plateau at a profoundly elevated baseline, not a recovery. In 2023-24, construction accounted for 27% of all company failures. The industry continues to suffer, recording 1,894 insolvencies in the financial year to February 10, 2026.
Crucially, firms are collapsing late in the distress cycle, exposed to the toxic legacy of fixed-price contracts signed before the 40% cost escalation. A secondary wave of pressure is coming from aggressive ATO debt enforcement and impending ‘Payday Super’ regulations. The data does not show resilience but rather an ongoing, structural depletion of industry capacity.
The Detached Housing Offset Fallacy
A secondary counter-narrative posits that a resurgence in detached housing approvals could offset the multi-unit deficit. January 2026 data showed a 1.1% monthly rise in private house approvals. While the detached sector has fewer feasibility barriers, it fundamentally lacks the volumetric scaling capacity to solve the overarching deficit.
Relying on detached housing contradicts the National Housing Accord’s mandate for ‘well-located’ homes, which implies high-density infill. Furthermore, the detached sector relies on SME builders, the segment most impacted by labour shortages and insolvencies. It lacks the industrialised economies of scale and geographic alignment to materially offset the collapse of the multi-unit pipeline.
Policy Frictions and Social Impediments
The mathematical constraints are entrenched by non-financial barriers. State-level interventions like land taxes, foreign investor surcharges, and infrastructure levies consistently elevate developer costs, widening the 24410 APN RLV Gap™.
Additionally, delivery is curtailed by socio-political dynamics captured by the 24440 APN Social Licence & Objection Velocity™ index, which measures community resistance. A profound paradox exists: while there is public frustration with restrictive planning, specific high-density proposals often face intense localised resistance (NIMBYism). This resistance translates into costly delays, which, in a high-interest-rate environment, can render projects financially non-viable.
The primary hypothesis is confirmed. The acute contraction in high-density dwelling approvals is a mathematical inevitability dictated by current macroeconomic parameters. The National Housing Accord’s target of 240,000 annual completions requires a velocity the sector has never achieved, even under optimal stimulus conditions. The five-year historical average is just 191,417 annual approvals.
High-density housing is structurally suppressed by the 4.10% cash rate environment. This has widened the 24410 APN RLV Gap™ and the 24450 APN Replacement Cost Gap™, creating a financial impasse for developers. Counter-indicators of insolvency stabilisation and detached housing growth are insufficient to offset the structural depletion of the sector’s capacity and the volumetric collapse in the multi-unit pipeline.
Ultimately, sovereign housing targets are policy constructs subject to the laws of capital allocation. Until macroeconomic conditions allow the 24410 APN RLV Gap™ to compress, through lower interest rates, systemic cost deflation, or a radical recalibration of land valuations, private institutional capital will continue to view state-mandated high-density targets as financially unviable. The objective of delivering 1.2 million dwellings by mid-2029 is mathematically constrained and, barring a profound paradigm shift, remains unachievable.
- Building Approvals, Australia, January 2026 – Australian Bureau of Statistics
- Australia Building Permits Unexpectedly Fall – Trading Economics
- Total approvals fall in January | Australian Bureau of Statistics
- Housing | Budget 2025–26
- Delivering the National Housing Accord | Treasury.gov.au
- Federal government nearly 80,000 homes behind on housing commitment – IPA
- Structural Capacity Constraints in Australia’s Housing Crisis: A System Dynamics Analysis of the National Housing Accord’s Unachievable Targets – MDPI
- Approvals fall in December, but 2025 finishes on a high note – HIA
- Statement by the Monetary Policy Board: Monetary Policy Decision | Media Releases | RBA
- Reserve Bank lifts official cash rate to 4.1% at March meeting – CommBank
- APN Codex Summaries v2.21 (March 2026)
- Agenda of Northern Beaches Council Meeting – Tuesday, 18 November 2025
- ECONOMIC TESTING – Western Sydney Affordable Housing Contribution Scheme – The Parks – NSW Government
- Pacific Real Estate Market Outlook 2026 | CBRE Australia
- Australian Business Insolvency by Industry 2026: Construction, Hospitality and the Restructuring Surge – Scale Suite
- Momentum returns to the building sector – Cotality
- What are the Biggest Issues in the Australian Construction Industry? – Access
- Australian construction price outlook – Q4 2025 – Altus Group
- Navigating Construction Industry Insolvency: Monitoring Insolvent Trading Risks
- Financial Services and Credit Monthly Update February 2026 – Dwyer Harris business lawyers
- State of the Housing System 2025 [DOCX 1.88 MB] – NHSAC
- Nightmare for first-home buyers as Perth’s median house price tips over $1m, experts blame ‘perfect storm’ – Reddit
- I’m Ged Kearney, the Labor member for Cooper & the Assistant Minister for Social Services and the Prevention of Family Violence in the Albanese Government. Ask Me Anything. : r/australian – Reddit
- NBN Co struggles to stack up for value against the competition – iTnews
