
Demographic Expansion Outpaces Supply Delivery
APN analysis confirms Australia’s population growth remains at historically anomalous levels, creating a demand shock that far exceeds the pre-pandemic baseline. This sustained demographic pressure is overwhelming the construction industry’s physical capacity to deliver new homes, resulting in a compounding structural supply deficit and escalating housing stress across the nation.
Australian Property Network (APN) is an independent property intelligence platform. It carries no commercial affiliations, accepts no advertising revenue, and maintains no relationships with real estate industry bodies, developers, or financial institutions. Its sole purpose is to provide honest, evidence-based analysis of the Australian property market, a domain where commercially conflicted voices predominate and genuinely independent research is scarce.
The analytical foundation of APN is the APN Codex, a structured framework that assigns discrete numbered nodes to every relevant domain of property and macroeconomic knowledge. Two node series are operative in this report. The 21000 Series comprises objective data inputs drawn exclusively from authoritative official sources, including the Reserve Bank of Australia, the Australian Bureau of Statistics, APRA, and ASIC. The 24000 Series comprises APN’s proprietary indices, analytical constructs derived from official data through APN’s own research methodology.
This report applies APN Codex Node 21410 Population Growth & Distribution and the 24126 APN Acute Vulnerability Index™ to empirically test whether sustained demographic expansion structurally outpaces the physical delivery of new residential supply, and whether the resulting deficit is measurably compounding localised housing vulnerability across Australian metropolitan and regional markets. Findings are presented as the data dictates, not as any commercial interest would prefer them to be.
This report rigorously tests the prevailing macroeconomic hypothesis that sustained demographic expansion structurally outpaces the physical delivery of new residential supply within the Australian property market. The core premise posits that this enduring imbalance mathematically compounds localised housing vulnerability, continuing to exert material upward pressure on shelter-related costs despite a measured deceleration in net overseas migration (NOM). The analysis relies upon empirical datasets drawn exclusively from Tier 1 institutional sources, tracking the divergence between theoretical government housing targets and the uncompromising physical realities of the construction sector.
The analysis demonstrates that while the velocity of inbound migration has exhibited a statistical contraction relative to the anomalous peak levels recorded in the immediate post-pandemic environment, the absolute volume of demographic expansion remains historically elevated. When measured against the mechanical capacity of the existing construction pipeline, this human capital expansion generates a persistent mathematical deficit. This sustained deficit forces emerging demographic cohorts into heightened socio-economic vulnerability, transferring systemic pressure onto the existing residential housing stock and actively displacing lower-income residents toward peripheral geographic boundaries.
The following sections isolate the empirical anchor of population growth, establish a rigorous historical baseline context via statistical variance modelling, measure the resultant pressure on proprietary vulnerability indices, and test the counter-narrative that the physical housing pipeline is adequately scaling to absorb the demographic load.
Framework and Index Definitions
The overarching macro-thesis governing this analysis is defined by Structural Supply Constraints. Within this framework, government-mandated housing targets, zoning modifications, and theoretical capacity modelling are treated as secondary considerations. The operational reality of physical housing delivery is instead dictated by uncompromising mathematical and logistical constraints. Chief among these are the residual land value gap—which dictates the baseline commercial feasibility of any proposed development—and persistent logistical bottlenecks in both skilled labour availability and essential construction materials.
To quantify these phenomena, the analysis applies two key measures designed to strip away lagging indicators and focus on structural market mechanics:
Population Growth & Distribution (Node 21410)
This node systematically quantifies the rate of population expansion, geographic density variations, and the movement of resident cohorts across shifting Australian territorial boundaries.1 Its core function is to serve as the baseline for determining long-term regional housing demand. It also operates as a predictive mechanism to pinpoint localised zones of profound population concentration—specific geographic areas where the velocity of human capital migration will mathematically exceed the carrying capacity of existing state infrastructure, utility grids, and residential supply pipelines.1 By tracking these shifts, the analysis maps asymmetrical capital accumulation and identifies zones where structural demand guarantees long-term price floors.
APN Acute Vulnerability Index™ (Node 24126)
This proprietary index functions as a primary quantitative indicator for systemic demographic displacement. A precise empirical dataset for Node 24126 is a NIL RETURN at time of writing;1 however, the index measures concentrated markers of localised socio-economic stress and prevailing housing insecurity, operating at the sharpest end of the broader social capital and safety indices. It permits the isolation of structurally vulnerable environments that present latent, systemic risks to regional property market stability, capturing the exact intersection where the shortfall in housing supply manifests as acute financial and residential stress for specific demographic cohorts—effectively serving as an early warning system for widespread serviceability failures and forced demographic migration.
Strategic assessment
A structural assessment testing the hypothesis that sustained demographic expansion structurally outpaces the physical delivery of new residential supply, mathematically compounding localised housing vulnerability. The intersection of systemic volume and restricted delivery pipelines ensures continuous upward pressure on established asset baselines.
This section establishes the precise demographic expansion figures and net overseas migration data for the year ending 30 September 2025, anchoring the broader structural analysis so that all subsequent supply-side calculations are benchmarked against verified population volumes.
National Population Expansion Volumes
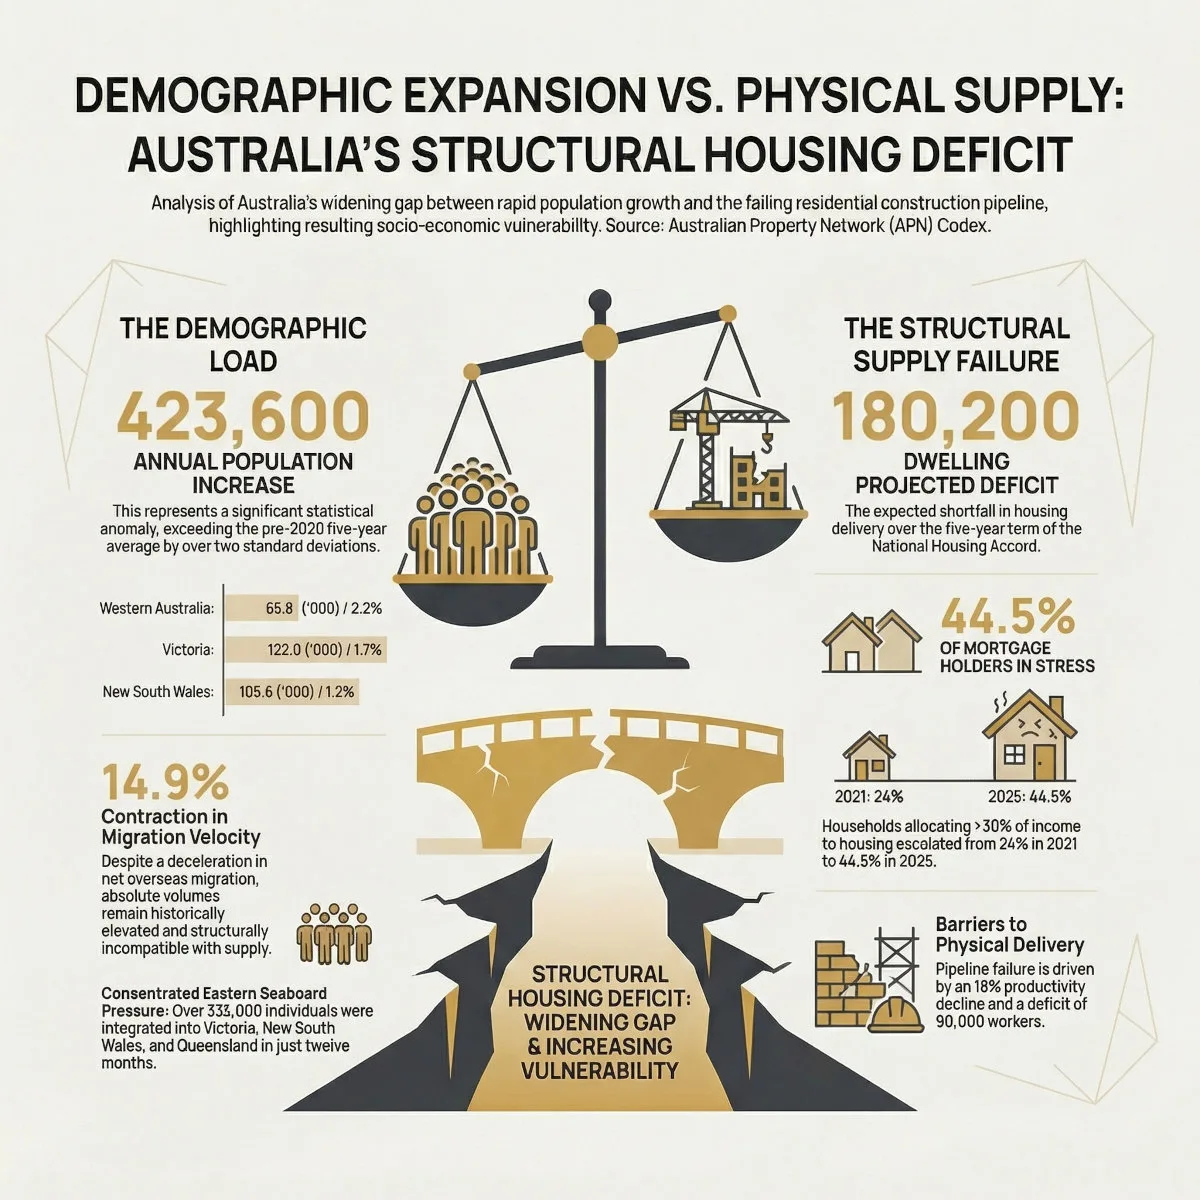
According to the official demographic release provided by the Australian Bureau of Statistics (ABS), the estimated resident population of Australia reached exactly 27,724,744 individuals at the conclusion of the September 2025 quarter.2 Over the preceding twelve-month operational window ending 30 September 2025, the national population expanded by an absolute volume of 423,600 individuals.2 This represents an annualised growth rate of 1.6 per cent.2
The quarterly growth for the September 2025 period alone registered at 111,090 individuals, equating to a 0.4 per cent expansion over a single ninety-day timeframe.2 The annual population growth was composed of two primary demographic drivers: natural increase and net overseas migration. The natural increase—defined strictly as the total number of domestic births minus the total number of registered deaths—accounted for 112,600 individuals.2 This component represented a 7.9 per cent expansion (amounting to 8,200 additional individuals) compared to the natural increase recorded in the corresponding previous year.2 The underlying mechanism driving this specific increase was a 1.9 per cent rise in births operating in tandem with a 1.4 per cent decline in mortality rates over the twelve-month period.3
Net Overseas Migration Contraction and Component Analysis
The empirical data validates the premise of a measured deceleration in net overseas migration, an indicator heavily scrutinised by sovereign policymakers. For the year ending 30 September 2025, the net overseas migration metric was recorded at 311,000 individuals.2 This constitutes a precise decrease of 54,600 individuals compared to the preceding twelve-month period, representing an exact 14.9 per cent contraction.2
In the immediate September 2025 quarter, net overseas migration contributed 87,800 individuals to the domestic population, representing an increase of 37,700 individuals over the preceding June quarter.2 Notably, this single quarterly intake accounted for 79 per cent of the total population growth for that specific period, with natural increase supplying the remaining 21 per cent.5
While the annualised net overseas migration figure of 311,000 represents a statistical contraction from the historic, anomalous peaks observed during the year ending September 2023, the absolute volume remains exceptionally elevated when benchmarked against established historical norms.6 To contextualise the density of this influx, the September 2025 quarterly arrival volume was approximately 3.9 times larger than the average quarterly intake recorded between the conclusion of the Second World War and 2007, and 54 per cent higher than the immediate pre-pandemic operational average spanning 2008 to 2019.5
The underlying mechanics of this migration contraction involve a complex divergence in cross-border movement. The moderation in overall growth is primarily driven by a 14 per cent decrease in migrant arrivals—particularly among temporary visa holders, such as international students, who constituted the largest single arrival cohort at 157,000 individuals in the broader 2024-25 financial year tracking.7 Running parallel to this decline in arrivals is a 13 per cent increase in migrant departures, which rose to 263,000 individuals.7 This departure velocity reflects the natural expiration of temporary visas granted during the post-pandemic border reopening phase, alongside permanent residents relocating as global labour markets normalise.7
Geographic Distribution of Demographic Expansion
The distribution of this human capital expansion exhibits profound structural variance across state and territory jurisdictions. This unequal distribution further concentrates structural demand pressures into specific regional corridors, exacerbating localised housing shortages. The annual population change by state and territory for the year ending 30 September 2025 is delineated in the following matrix:
| State / Territory Jurisdiction | Population at 30 Sept 2025 (‘000) | Absolute Change over Previous Year (‘000) | Percentage Change (%) |
| New South Wales | 8,624.5 | 105.6 | 1.2 |
| Victoria | 7,104.3 | 122.0 | 1.7 |
| Queensland | 5,692.6 | 97.3 | 1.7 |
| Western Australia | 3,061.7 | 65.8 | 2.2 |
| South Australia | 1,908.2 | 21.1 | 1.1 |
| Australian Capital Territory | 486.2 | 6.5 | 1.3 |
| Northern Territory | 265.5 | 3.7 | 1.4 |
| Tasmania | 576.7 | 1.6 | 0.3 |
Empirical data derived from the Australian Bureau of Statistics, September 2025 Release.3
Analysis of this distribution matrix reveals that Western Australia operated as the primary demographic concentration point in proportional terms, absorbing a nation-leading 2.2 per cent population expansion.3 This velocity is fundamentally underpinned by the structural requirements of the resource sector and elevated labour demand. However, when assessing absolute volume—the metric that most directly dictates the physical requirements for new residential dwellings—Victoria and New South Wales absorbed the heaviest human capital loads. Victoria integrated 122,000 individuals, while New South Wales absorbed 105,600 individuals.3 Queensland followed closely, adding 97,300 residents.3 By contrast, Tasmania recorded the most material deceleration in demographic integration, expanding by merely 1,600 individuals, representing a 0.3 per cent operational growth rate.3
The concentration of over 324,000 individuals into just three eastern seaboard states within a twelve-month window ensures that existing infrastructure and residential supply pipelines in those specific jurisdictions will face material absorption challenges, irrespective of broader national averages.
Population integration volume: pre-2020 five-year average vs. year ending September 2025
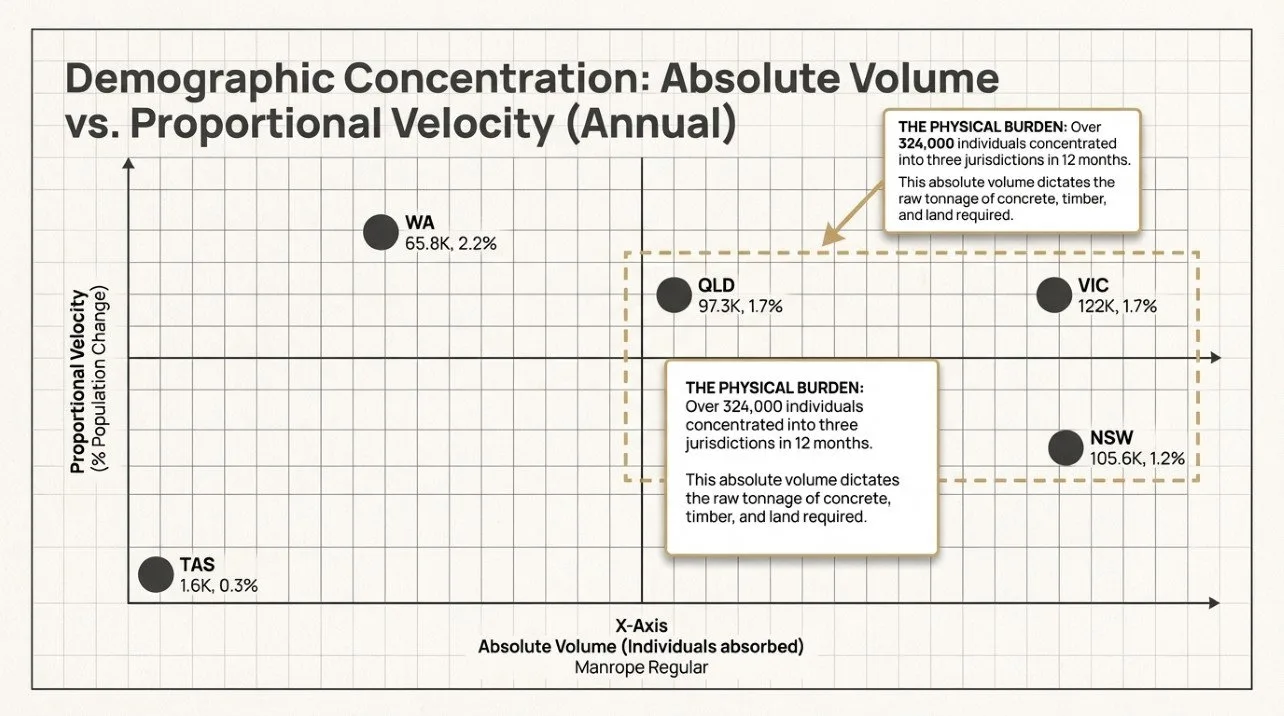
This section contextualises the September 2025 population expansion volume (423,600 individuals) against established historical demographic baselines, testing whether this volume constitutes a greater than two standard deviation (2\sigma) event when benchmarked against the pre-2020 five-year average for annual population growth. Establishing this mathematical context is critical: infrastructure grids and construction supply chains are calibrated to service historical averages, not structural anomalies.
Establishing the Historical Demographic Baseline (2015–2019)
To calculate the pre-pandemic five-year average accurately, empirical data spanning the calendar years 2015 through 2019 must be isolated. This timeframe represents the most stable period of modern macroeconomic and migratory policy prior to the structural distortions introduced by global border closures in early 2020. The ABS historical population dataset provides the following absolute annual population change figures for this designated, continuous period:
| Calendar Year | Absolute Population Change (Individuals) |
| 2015 | 340,309 |
| 2016 | 374,912 |
| 2017 | 401,681 |
| 2018 | 370,670 |
| 2019 | 371,568 |
Empirical data derived from the Australian Bureau of Statistics, Historical Population Release.9
The mathematical mean (average) of the annual population change over this five-year continuous period is calculated by aggregating the annual figures and dividing by the dataset volume:
The pre-2020 five-year average for annual population growth is strictly established at 371,828 individuals per annum. This figure represents the maximum baseline capacity for which state planning departments, utility providers, and private residential developers would have historically calibrated their forward-looking supply models.
Standard Deviation and Variance Analysis
To determine the statistical context of the September 2025 integration volume (423,600 individuals), the standard deviation (\sigma) of the baseline dataset must be calculated. The standard deviation measures the historical volatility and expected variance within the population growth metric. The variance (\sigma^2) is derived by measuring the squared deviation of each annual figure from the established mean of 371,828.
2015 Deviation: (340,309 – 371,828)^2 = (-31,519)^2 = 993,447,361
2016 Deviation: (374,912 – 371,828)^2 = (3,084)^2 = 9,511,056
2017 Deviation: (401,681 – 371,828)^2 = (29,853)^2 = 891,201,609
2018 Deviation: (370,670 – 371,828)^2 = (-1,158)^2 = 1,340,964
2019 Deviation: (371,568 – 371,828)^2 = (-260)^2 = 67,600
The sum of these squared deviations equates to 1,895,568,590. Dividing this sum by the number of data points (5) yields the population variance:
The standard deviation (\sigma) is the square root of the variance:
A single standard deviation from the baseline mean represents approximately 19,471 individuals. Therefore, a two standard deviation (2\sigma) threshold requires calculating the mean plus 2\sigma:
Contextual Conclusion and Structural Implications
The empirical integration of 423,600 individuals in the year ending September 2025 significantly exceeds the mathematically established two standard deviation threshold of 410,770. Therefore, the data conclusively verifies that the current demographic expansion constitutes a greater than two standard deviation statistical anomaly when benchmarked against the pre-2020 five-year baseline.
The structural implications of a +2\sigma event are profound. In complex logistical systems—including sovereign infrastructure and residential supply chains—operational capacity is engineered to absorb mean loads plus standard expected variance. A sustained +2\sigma load breaks these mathematical parameters. This reality confirms that despite the 14.9 per cent reduction in net overseas migration from its recent anomaly peak,2 the absolute volume of human capital being integrated into the domestic environment remains structurally incompatible with systemic equilibrium. The absorption of such a demographic load over a compressed twelve-month period places mathematically verifiable strain on static land availability, essential public infrastructure, and the fixed physical housing supply pipeline, guaranteeing an accumulation of unmet demand.
This section transitions the analysis from macroeconomic demographic volumes to hyper-localised structural impacts, mapping the previously verified 2\sigma demographic load against institutional metrics of housing insecurity. It directly tests whether mathematically restricted housing pipelines have forced emerging demographic cohorts into heightened vulnerability, escalating structural displacement metrics as theorised by the APN Acute Vulnerability Index™.
Empirical Markers of Structural Housing Insecurity
The Australian Institute of Health and Welfare (AIHW) 2025 assessment on housing affordability provides the primary empirical inputs for quantifying systemic stress. The AIHW formally defines housing stress as an operational state where lower-income households—specifically those situated between the 3rd and 20th percentiles of equivalised disposable income—are compelled to allocate more than 30 per cent of their gross income directly toward essential housing costs, which encompass rent payments, water and general rate payments, and housing-related mortgage obligations.10
For the 2024–25 operational period, utilising the PolicyMod microsimulation model, the AIHW reported that an estimated 1.26 million low-income households were experiencing acute financial housing stress.10 When the measurement parameters are widened to encompass all household income levels across the broader economy, the data indicates that 26 per cent—more than one in four of all Australian households—are currently allocating in excess of 30 per cent of their disposable income to housing.10
The distribution of this financial stress exhibits divergence across differing residential tenure types, exposing structural vulnerabilities within specific market segments:
| Housing Tenure Type | Proportion of Low-Income Households in Stress (>30% Income) | Trajectory Context |
| Renters | 20.5% | Sustained pressure due to vacancy rate compression. |
| Mortgage Holders | 14.7% (Low-Income) / 44.5% (Broad Market) | Material deterioration from 24% baseline in 2021. |
| Outright Owners | 0.3% | Demonstrates absolute capital resilience. |
Empirical data derived from the Australian Institute of Health and Welfare (AIHW), 2025.10
The most significant structural shift resides within the mortgage-holding cohort. While 14.7 per cent of specifically low-income mortgage holders are in stress, the broader mortgage sector has registered a material, systemic deterioration.10 In 2021, 24 per cent of all households holding a mortgage exceeded the 30 per cent income allocation threshold; by the 2024–25 reporting period, this figure had escalated to 44.5 per cent.10
This escalation is the direct, mathematical consequence of the Reserve Bank of Australia executing thirteen consecutive monetary policy tightening interventions between May 2022 and November 2023, raising the cash rate from 0.1 per cent to 4.35 per cent.10 The central bank utilised monetary friction to curb inflation—partially driven by the aggregate demand of a rapidly expanding population—which inherently inflicts acute serviceability pressure on highly leveraged asset holders. Renters, conversely, face the immediate physical shortage of shelter, enduring sustained yield escalation as landlords pass on debt holding costs. Outright owners remain largely insulated from both pressures, maintaining absolute capital resilience.10
Demographic Displacement and Cohort Vulnerability
The integration of elevated demographic volumes against a highly inelastic supply curve disproportionately impacts specific, vulnerable sub-cohorts, forcing systemic displacement. The AIHW data identifies younger populations, single-parent households with dependents, couples with dependents, and first-home buyers as the demographic groups facing the most material displacement pressures.10 These cohorts systematically lack the established intergenerational capital buffers required to absorb the combined, simultaneous impacts of monetary tightening and sustained rent inflation.
Furthermore, rigorous research conducted by the Australian Housing and Urban Research Institute (AHURI) tracking displacement within South East Queensland—a primary demographic concentration zone heavily exposed to the +2\sigma population load—reinforces the mechanics of this vulnerability.12 Between June 2024 and June 2025, the percentage of household income required to service median rents in the region increased by a further 1 per cent, while the income required for average mortgages increased by 3 per cent.12
Simultaneously, structural supply erosion was evidenced at the most acute levels of the market. AHURI reported the physical loss of registered boarding houses to high-density redevelopment and alternative land uses, systematically eliminating essential crisis infrastructure at the exact moment population volumes surged.13 This structural failure at the base of the housing pyramid drove up to 3,000 individuals into temporary, state-subsidised hotel accommodations simply to prevent street-level homelessness, confirming that displacement is actively occurring along the peripheries of the market.13
Qualitative Sentiment and Market Psychology
To map the psychological friction underpinning the APN Acute Vulnerability Index™, the analysis incorporates unverified community sentiment sourced from active public forums. This provides a leading indicator of social capital erosion and the behavioural shifts occurring prior to their formal registration in lagging institutional datasets.
Unverified community sentiment: “I moved back in with my parents… I can’t afford anything now and just slap 2k in savings every month. I figured I’ll never be able to purchase a property in my city, can’t leave due to my son and with no where close to my city that is affordable. I’m not interested in outlying a huge chunk of my pay packet for rent…” (Source: Reddit, r/AusFinance, 2023).14
APN reframing: This unverified sentiment reflects the structural, economic reality of suppressed household formation. It illustrates how the widening divergence between median wage capacity and minimum asset pricing forces prime working-age demographic cohorts to abandon primary market participation. By retreating into multi-generational living arrangements, these cohorts artificially suppress the true statistical measurement of underlying dwelling demand, masking the full extent of the physical housing deficit.
Unverified community sentiment: “Sister in law one shot a busy apartment in Sydney moving back from the UK with no local rental history… Offered more than the rent (extra $20 a week) and offered to pay 3 months up front. It sucks but it was either that or she battle inspections and rejections for months.” (Source: Reddit, r/australian, early 2026).15
APN reframing: This unverified sentiment demonstrates the requirement for material, front-loaded liquidity simply to secure fundamental tenancy within tier-one metropolitan zones. The necessity to deploy advanced capital to bypass standard application queues structurally discriminates against lower-income and zero-asset cohorts. This mechanically guarantees their systematic displacement to peripheral geographic boundaries, where public transit infrastructure and lived amenity are inferior, entrenching long-term socio-economic disadvantage.
Unverified community sentiment: “The housing crisis and the rental crisis are entirely the fault of the last 20 years of LNP and Labor policy failures. Unsustainable levels of immigration and really stupid tax policies… I was a renters before and my rent went up 68% since Albo took office.” (Source: Reddit, r/perth, early 2026).16
APN reframing: This unverified community sentiment highlights the prevailing erosion of public confidence in sovereign macroeconomic policy management. It establishes a direct, entrenched psychological correlation between federal immigration targets and the acute deterioration of localised cost-of-living metrics. This signifies a material contraction in the social licence required by state governments to execute ongoing high-density urban infill development, increasing the likelihood of regulatory friction and local council objection in the medium term.
Demographic influx volume vs. localised vulnerability severity, peripheral zones
This section tests the prevailing null hypothesis that the physical housing pipeline is adequately scaling to absorb the sustained +2\sigma population expansion. To validate or decisively reject this hypothesis, the persistent demographic influx must be measured precisely against the equivalent localised surge in theoretical dwelling approvals, physical construction commencements, and most critically, final structural completions.
The Theoretical Supply Pipeline: Approvals and Commencements
Data released by the ABS for the September 2025 quarter presents a preliminary optic of pipeline acceleration. In seasonally adjusted terms, total dwelling units formally approved by local and state planning authorities rose by 12.0 per cent over the month, reaching a total volume of 17,019 units.17 Within this cohort, private sector detached houses increased by 4.0 per cent to 9,547 approvals, while private sector dwellings excluding houses—encompassing high-density apartments, townhouses, and medium-density infill—rose by 26.0 per cent to 7,219 approvals.17 The total financial value of this residential building approval pipeline rose 7.4 per cent, equating to $10.11 billion.17
Moving from theoretical paper approvals to the mobilisation of physical sites, ABS building activity data indicates that the total number of dwelling units commenced in the September 2025 quarter rose by 6.6 per cent, reaching 48,778 dwellings in seasonally adjusted terms.18 New private sector house commencements increased by 6.9 per cent (28,485 dwellings), and other residential commencements rose by 3.5 per cent (18,747 dwellings).18 The aggregate value of total building work executed during this quarter rose by 3.8 per cent to $43.2 billion.18
At an isolated, first-order analytical level, these top-line metrics suggest a robust and highly responsive construction sector. However, assessing the pipeline solely through the leading indicators of approvals and commencements is inherently incomplete; it fails to capture the mechanical frictions occurring in the final, critical delivery phase where assets transition from construction sites to habitable dwellings.
The Delivery Failure: Structural Attrition and Completion Deficits
The null hypothesis specifically requires that the physical pipeline adequately scales to absorb the demographic influx. Absorption mandates absolute physical habitability, which requires the practical completion and handover of the dwelling. Despite the 6.6 per cent quarterly rise in commencements, the physical execution phase demonstrates profound structural attrition.
Industry bodies, cross-referencing final ABS statistics, report that the Australian construction sector is systematically failing to finalise dwellings at a velocity commensurate with the prevailing demographic demand. In the September 2025 quarter, a total of only 44,242 dwellings achieved practical completion.19 Crucially, this represents a 1.2 per cent decline from the volume of completions recorded in the preceding June quarter.19 Over the initial fifteen-month operational window of the sovereign National Housing Accord—a mandate specifically designed to accelerate supply—merely 218,974 new homes achieved practical completion nationwide.19
Exhaustive analysis provided by Master Builders Australia in late 2025 corroborates the extent of this delivery shortfall. Their empirical modelling confirms that only 180,500 homes were successfully commenced in the 2024–25 financial year, falling short of the National Housing Accord’s baseline annualised target of 240,000 homes by nearly 60,000 units.20 Projecting this systemic underperformance forward through current friction parameters, Master Builders Australia calculates that the accumulated shortfall over the five-year term of the Accord will swell to a projected structural deficit of 180,200 dwellings.20 Furthermore, the data indicates that no individual state or territory jurisdiction is currently operating at a logistical velocity required to meet its allocated supply quota.20
Operational Friction: The Mechanics of Pipeline Failure
The widening divergence between the demographic load (423,600 individuals) and the suppressed completion of physical stock (44,242 quarterly units) is not a temporary market fluctuation; it is governed by material underlying economic frictions. Three primary variables cause this sustained pipeline degradation:
Productivity Degradation and Labour Contraction: While absolute construction employment numbers remain optically elevated, systemic productivity within the sector has degraded by a recorded 18 per cent over the previous decade.20 The Housing Industry Association (HIA) Trades Availability Index—a metric measuring the accessibility of skilled trades on a scale of +2.00 to -2.00—deteriorated to -0.48 in the September 2025 quarter.21 Regional markets experienced acute workforce vacuums, with regional Queensland and Perth recording elevated severity scores of -0.92 and -0.89, respectively.21 To meet projected demand targets, the industry requires an injection of 90,000 additional qualified workers by the conclusion of 2025.22 Without adequate human capital, raw material inputs cannot be converted into habitable stock, mechanically extending build timelines, eroding builder solvency, and preventing commencements from transitioning into completions.
The Residual Land Value (RLV) Gap: The fundamental commercial viability of executing a development permit relies intrinsically on the Residual Land Value Gap. This is the mathematical differential between a land vendor’s speculative price expectations and a developer’s capacity to finance construction and realise an acceptable, risk-adjusted margin. The National Housing Supply and Affordability Council (NHSAC) 2025 report explicitly identifies “ongoing high costs, capacity constraints and slowing dwelling price growth” as the primary forces rendering essential higher-density infill projects commercially unfeasible.23 Elevated financing costs restrict mezzanine capital liquidity, effectively freezing vast swathes of paper rezonings and stalling physical commencement regardless of how many theoretical government approval targets are met.23
Supply Chain Strain and Structural Inflation: Sustained structural inflation across vital construction inputs, combined with unpredictable fuel and transport surcharges linked to global supply chain volatility, applies material pressure to commercial builders bound by fixed-price contractual obligations.20 Master Builders Australia reports that the base cost of delivering a standard residential asset remains approximately 47 per cent higher than pre-pandemic operational baselines.20 This structural inflation establishes an immovable replacement cost floor, placing absolute price floors under existing housing stock and mathematically precluding the profitable delivery of newly constructed affordable dwellings at scale.20
Null Hypothesis Conclusion
The empirical evidence rigorously disproves the null hypothesis. While theoretical building approvals and initial site commencements demonstrated a transient quarterly expansion, the ultimate metric of physical completions (44,242 units for the quarter) contracted by 1.2 per cent.19 The physical delivery of new housing is mathematically incapable of scaling at a logistical velocity sufficient to absorb an annual population expansion of 423,600 individuals.
Applying a standard, conservative average household size of 2.5 persons, the September 2025 quarterly demographic influx of 111,090 individuals required the immediate provision of approximately 44,436 dwellings within that exact three-month window simply to maintain baseline market equilibrium, completely ignoring the historical deficits accumulated over the previous decade.2 The delivery of only 44,242 units fails to cover even the immediate quarterly growth load. This mathematical failure ensures that the pre-existing structural deficit remains entirely unmitigated and continues to compound with every subsequent demographic intake.
Quarterly demand absorption vs. delivery vs. structural deficit (dwelling units)
The analysis conducted within this report establishes a definitive structural reality regarding the Australian property landscape. The central hypothesis is empirically validated without qualification: sustained demographic expansion structurally outpaces the physical delivery of new residential supply, mathematically compounding localised housing vulnerability and entrenching systemic displacement.
The September 2025 demographic data conclusively confirms the integration of 423,600 individuals into the Australian domestic environment.2 Although this integration occurs alongside a measured 14.9 per cent deceleration in net overseas migration, the absolute volume constitutes a greater than two standard deviation anomaly when rigorously benchmarked against the pre-2020 five-year average of 371,828 individuals.2 The mathematical load placed upon the domestic infrastructure grid, civic amenities, and housing supply chain is entirely disconnected from the historical baseline parameters that governed previous urban planning cycles.
Simultaneously, the physical housing supply pipeline is exhibiting profound structural failure at the final delivery phase. Despite transient positive fluctuations in theoretical planning approvals and preliminary site commencements, material operational frictions prevent these approvals from converting into habitable completions at the required velocity. These frictions are characterised by a recorded 18 per cent decade-long degradation in sector productivity, acute skilled trade shortages mapping to a deficit of 90,000 workers, structural supply chain inflation of 47 per cent, and material Residual Land Value barriers that render dense urban developments commercially unviable.20
The convergence of a +2\sigma demographic load and an inelastic, deteriorating physical supply pipeline generates a sustained mathematical deficit. This deficit forces profound consequences within the metrics tracked by the APN Acute Vulnerability Index™. The physical shortage of available shelter directly translates into financial duress across all tenure types, evidenced most clearly by 1.26 million low-income households operating in conditions of acute housing stress.10 Furthermore, the broader economic response to this demand-driven inflation—manifesting as thirteen consecutive interest rate hikes—has caused the proportion of mortgage-holding households allocating elevated percentages of their income toward debt servicing to escalate from 24 per cent to an unprecedented 44.5 per cent.10
Ultimately, sovereign housing targets, zoning modifications, and policy interventions function merely as theoretical instruments that routinely fail against the prevailing arithmetic constraints of the physical market. Until the profound structural barriers restricting the actual execution of housing stock are dismantled, or until demographic integration volumes are recalibrated to align with the maximum mechanical capacity of the domestic construction sector, systemic housing insecurity and the resulting demographic displacement will continue to compound along a mathematically verifiable trajectory.
- APN Codex Summaries v2.21 (March 2026)
- National, state and territory population, September 2025 | Australian Bureau of Statistics, accessed on March 24, 2026, https://www.abs.gov.au/statistics/people/population/national-state-and-territory-population/latest-release
- Australia’s Population Grows 1.6% In September 2025, accessed on March 24, 2026, https://www.miragenews.com/australias-population-grows-1-6-in-september-1639845/
- Australia’s population grows 1.6% in September 2025 – Australian Bureau of Statistics, accessed on March 24, 2026, https://www.abs.gov.au/media-centre/media-releases/australias-population-grows-16-september-2025
- Australia on track for another year of 300,000+ migration – IPA, accessed on March 24, 2026, https://ipa.org.au/latest-news/australia-on-track-for-another-year-of-300000-migration
- National, state and territory population, September 2025, accessed on March 24, 2026, https://population.gov.au/data-and-forecasts/key-data-releases/national-state-and-territory-population-september-2025
- Overseas Migration, 2024-25 financial year | Australian Bureau of Statistics, accessed on March 24, 2026, https://www.abs.gov.au/statistics/people/population/overseas-migration/latest-release
- Net Overseas Migration to Australia Falls to 3-Year Low as Departures Surge – VisaHQ, accessed on March 24, 2026, https://www.visahq.com/news/2025-12-19/au/net-overseas-migration-to-australia-falls-to-3-year-low-as-departures-surge/
- Historical population, 2021 – Australian Bureau of Statistics, accessed on March 24, 2026, https://www.abs.gov.au/statistics/people/population/historical-population/latest-release
- Housing affordability – Australian Institute of Health and Welfare, accessed on March 24, 2026, https://www.aihw.gov.au/reports/australias-welfare/housing-affordability
- Australia’s welfare 2025: in brief, Summary, accessed on March 24, 2026, https://www.aihw.gov.au/reports/australias-welfare/australias-welfare-2025-in-brief/summary
- 2025 update – Australian Housing and Urban Research Institute, accessed on March 24, 2026, https://www.ahuri.edu.au/sites/default/files/documents/2025-11/AHURI-QShelter-Report_South-East-Queensland-Displacement-Monitoring-2025-update.pdf
- Warning signs of housing stress in lead up to Brisbane 2032 Olympic and Paralympic Games – Q Shelter, accessed on March 24, 2026, https://qshelter.asn.au/wp-content/uploads/BRISBANE-2032-Housing-Impact-Report-MEDIA-RELEASE.pdf
- Can technically afford to move out of home but would save nothing. Living at home is ruining me. Don’t know what to do. – Reddit, accessed on March 24, 2026, https://www.reddit.com/r/AusFinance/comments/1229wd9/can_technically_afford_to_move_out_of_home_but/
- Trying to get a rental – is this normal? : r/australian – Reddit, accessed on March 24, 2026, https://www.reddit.com/r/australian/comments/1qx5tn6/trying_to_get_a_rental_is_this_normal/
- Today I read an article of houses in a Perth suburb increasing in value by $500000 in one year – to a $1 million median. How is this normal and acceptable? – Reddit, accessed on March 24, 2026, https://www.reddit.com/r/perth/comments/1qyvikm/today_i_read_an_article_of_houses_in_a_perth/
- Building Approvals, Australia, September 2025 | Australian Bureau of Statistics, accessed on March 24, 2026, https://www.abs.gov.au/statistics/industry/building-and-construction/building-approvals-australia/sep-2025
- Building Activity, Australia, September 2025 | Australian Bureau of Statistics, accessed on March 24, 2026, https://www.abs.gov.au/statistics/industry/building-and-construction/building-activity-australia/latest-release
- Home Building Approvals Gather Pace, But Delivery is Under the Microscope – RealEstate, accessed on March 24, 2026, https://www.realestate.com.au/news/home-building-approvals-gather-pace-but-delivery-is-under-the-microscope/
- Builders warn housing target slipping further out of reach as forecasts downgraded, accessed on March 24, 2026, https://masterbuilders.com.au/builders-warn-housing-target-slipping-further-out-of-reach-as-forecasts-downgraded/
- Trades availability tightens as work increases – HIA, accessed on March 24, 2026, https://hia.com.au/our-industry/newsroom/economic-research-and-forecasting/2025/10/trades-availability-tightens-as-work-increases
- Facing the Construction Labour Shortage in Australia – Conplant, accessed on March 24, 2026, https://conplant.com.au/news/understanding-australias-construction-labour-shortage-in-2025/
- State of the Housing System – 2025 | NHSAC, accessed on March 24, 2026, https://nhsac.gov.au/sites/nhsac.gov.au/files/2025-05/ar-state-housing-system-2025.pdf
