Editor’s Note: This is Part 1 of the APN Insight series, “The Anatomy of a Crisis.” The series was prompted by a viral video from MacroBusiness economist Leith van Onselen, which crystallised the scale of the nation’s housing shortfall.
In Part 1, we dissect the foundational numbers. In Part 2, we investigate the structural reasons why we can’t build faster. And in Part 3, we explore the controversial demand-side factors to ask: is it the whole story?
For a full breakdown of the data and sources, you can access the complete consolidated APN Research Report here.
Australia’s 30,000-Home Deficit: Dissecting the Numbers Behind the Housing Shortfall
In a recent video, economist Leith van Onselen of MacroBusiness presented a devastatingly simple calculation that has become the focal point of Australia’s housing debate. The stark reality, he argued, is a direct calculation based on the collision of record population growth and an underperforming construction sector.
For property professionals, investors, and policymakers, understanding the mechanics of this shortfall is no longer an academic exercise; it’s a critical necessity for navigating the challenging landscape ahead. This analysis moves beyond the national headline to dissect the deficit at a state level, revealing where the housing pressure is most acute and what it means for the market’s future.
The National Equation: A More Complex Reality
At its core, the national housing deficit is a mismatch between demand and supply. However, updated data reveals a more complex picture than a simple calculation suggests. The demand side is driven by two distinct forces: immediate population growth and a powerful, long-term structural decline in household size.
The foundational calculation, based on the most recent data, is as follows:
- Population Growth: Australia’s population growth was supercharged by an estimated Net Overseas Migration (NOM) of 446,000 people for the 2023-24 financial year.
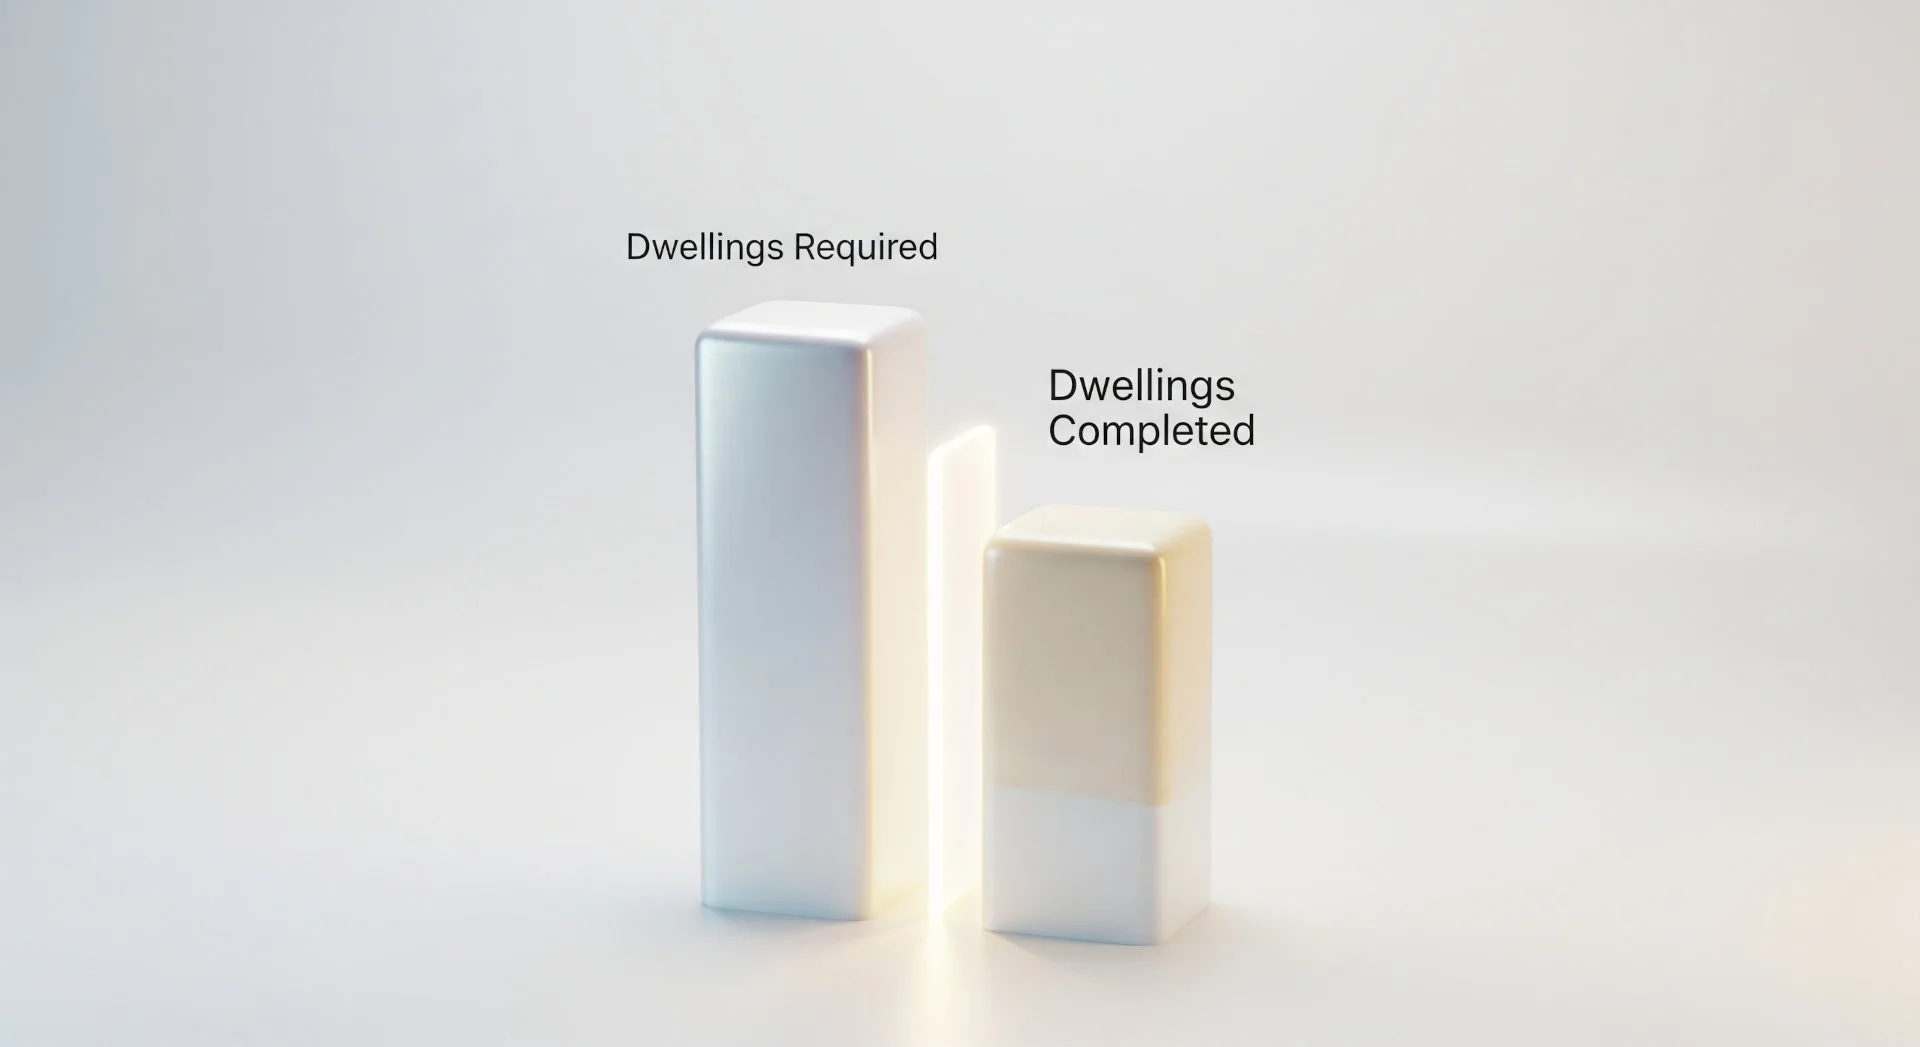
- Dwelling Requirement: Based on an average household size of 2.5 people, this population influx requires the construction of approximately 178,400 new dwellings to maintain equilibrium.
- Supply Shortfall: The construction industry, however, is only managing to complete around 177,000 new dwellings annually.
This creates a direct annual deficit from new migration of approximately 1,400 dwellings.
However, this small number is misleading as it ignores the powerful underlying demand generated by the century-long decline in average household size. During the COVID-19 pandemic, a sharp drop in household size created underlying demand for an additional 120,000 households, demonstrating that this internal trend is a massive, and often overlooked, driver of the true housing shortage.
State-Level Deep Dive: Where the Pressure Cooker is Hottest
The national housing deficit is not evenly distributed. A state-by-state analysis reveals the housing crunch is far more severe in the jurisdictions absorbing the largest share of migrants, while their residential construction sectors fail to keep pace.
- New South Wales & Victoria: The Epicentres of the Shortfall. As the primary destinations for overseas migrants, NSW and Victoria are facing the most acute housing deficits.
- NSW: The state requires over 75,000 new homes annually but completed only 45,552 in 2024. This creates a staggering annual deficit of approximately 30,000 homes.
- Victoria: The state has a target of building 80,000 new dwellings but is completing around 60,000 annually. This confirms an annual deficit of approximately 20,000 homes.
- Queensland & Western Australia: Mounting Pressure. These states are also feeling the strain, driven by both international and significant interstate migration.
- Western Australia: Now the nation’s fastest-growing state, WA completed over 20,000 homes in 2024 but still fell 4,000 homes short of its annual target. Forecasts suggest this deficit is set to widen significantly.
The Inevitable Consequences: More Than Just Numbers
This statistical deficit translates directly into tangible, real-world consequences that are reshaping Australia’s social and economic fabric.
The most immediate outcome is sustained and severe upward pressure on rents. With tens of thousands more households competing for an insufficient pool of available housing, national vacancy rates have plummeted to historic lows, with cities like Perth and Adelaide consistently tracking below 1%.
For the property sales market, the chronic undersupply provides a powerful floor under property prices. Despite the most aggressive interest rate hiking cycle in a generation, the fundamental lack of available housing has counteracted this effect, with economists from the RBA to the major banks agreeing that the supply-demand imbalance is the primary driver of resilient property values.
Ultimately, this dynamic leads to worsening housing stress for a growing cohort of Australians, entrenching wealth inequality between property owners and the one-third of households that rent.
Disclaimer
The information contained in this article is for general informational purposes only and does not constitute financial, investment, or legal advice. The Australian Property Network (APN) is not a licensed financial advisor. The content is based on data from third-party sources and is provided without any warranty as to its accuracy, currency, or completeness. Property values can go down as well as up. Before making any property or investment decisions, you should conduct your own research and consider seeking independent professional advice tailored to your specific circumstances.