
Structural Contraction: Australian Construction Sector Decouples, Creating ‘Unbuildable’ Asset Class
APN ANALYSIS: A-251124-AUS131026
Executive Summary
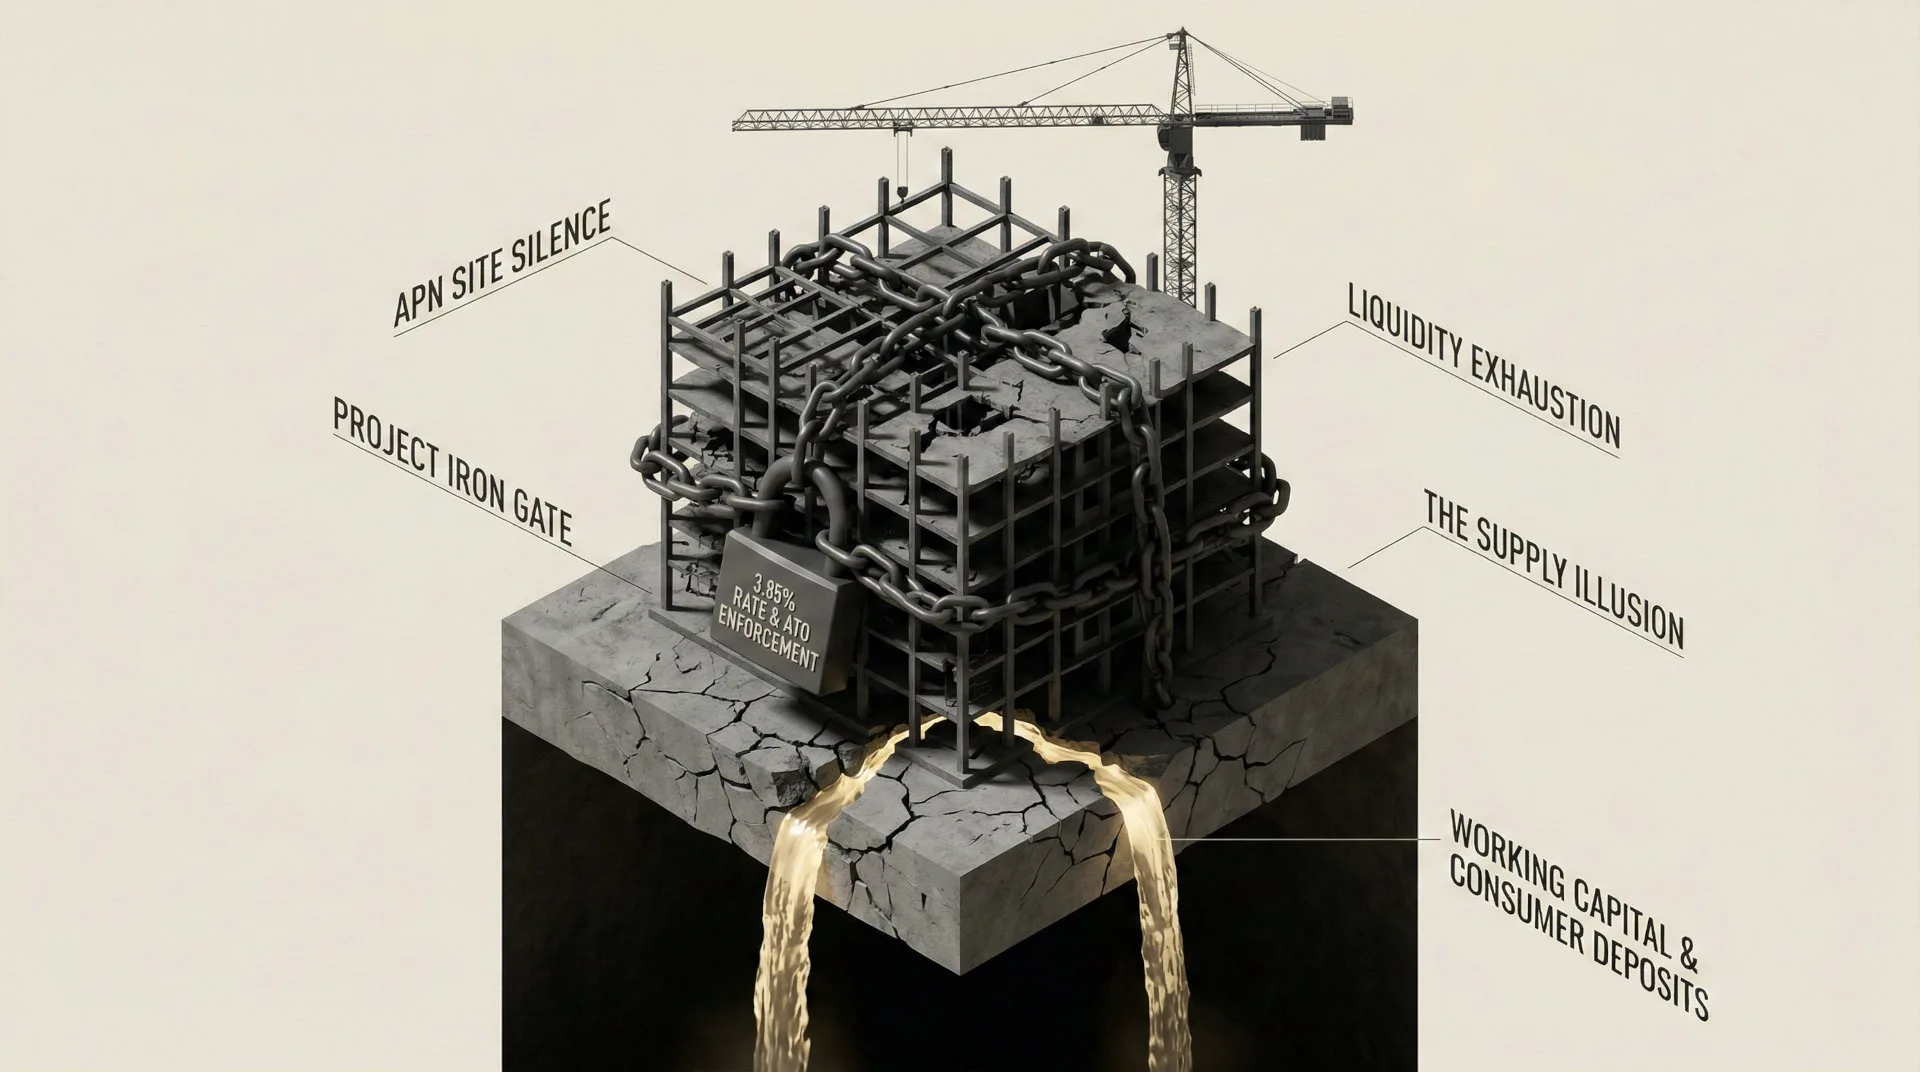
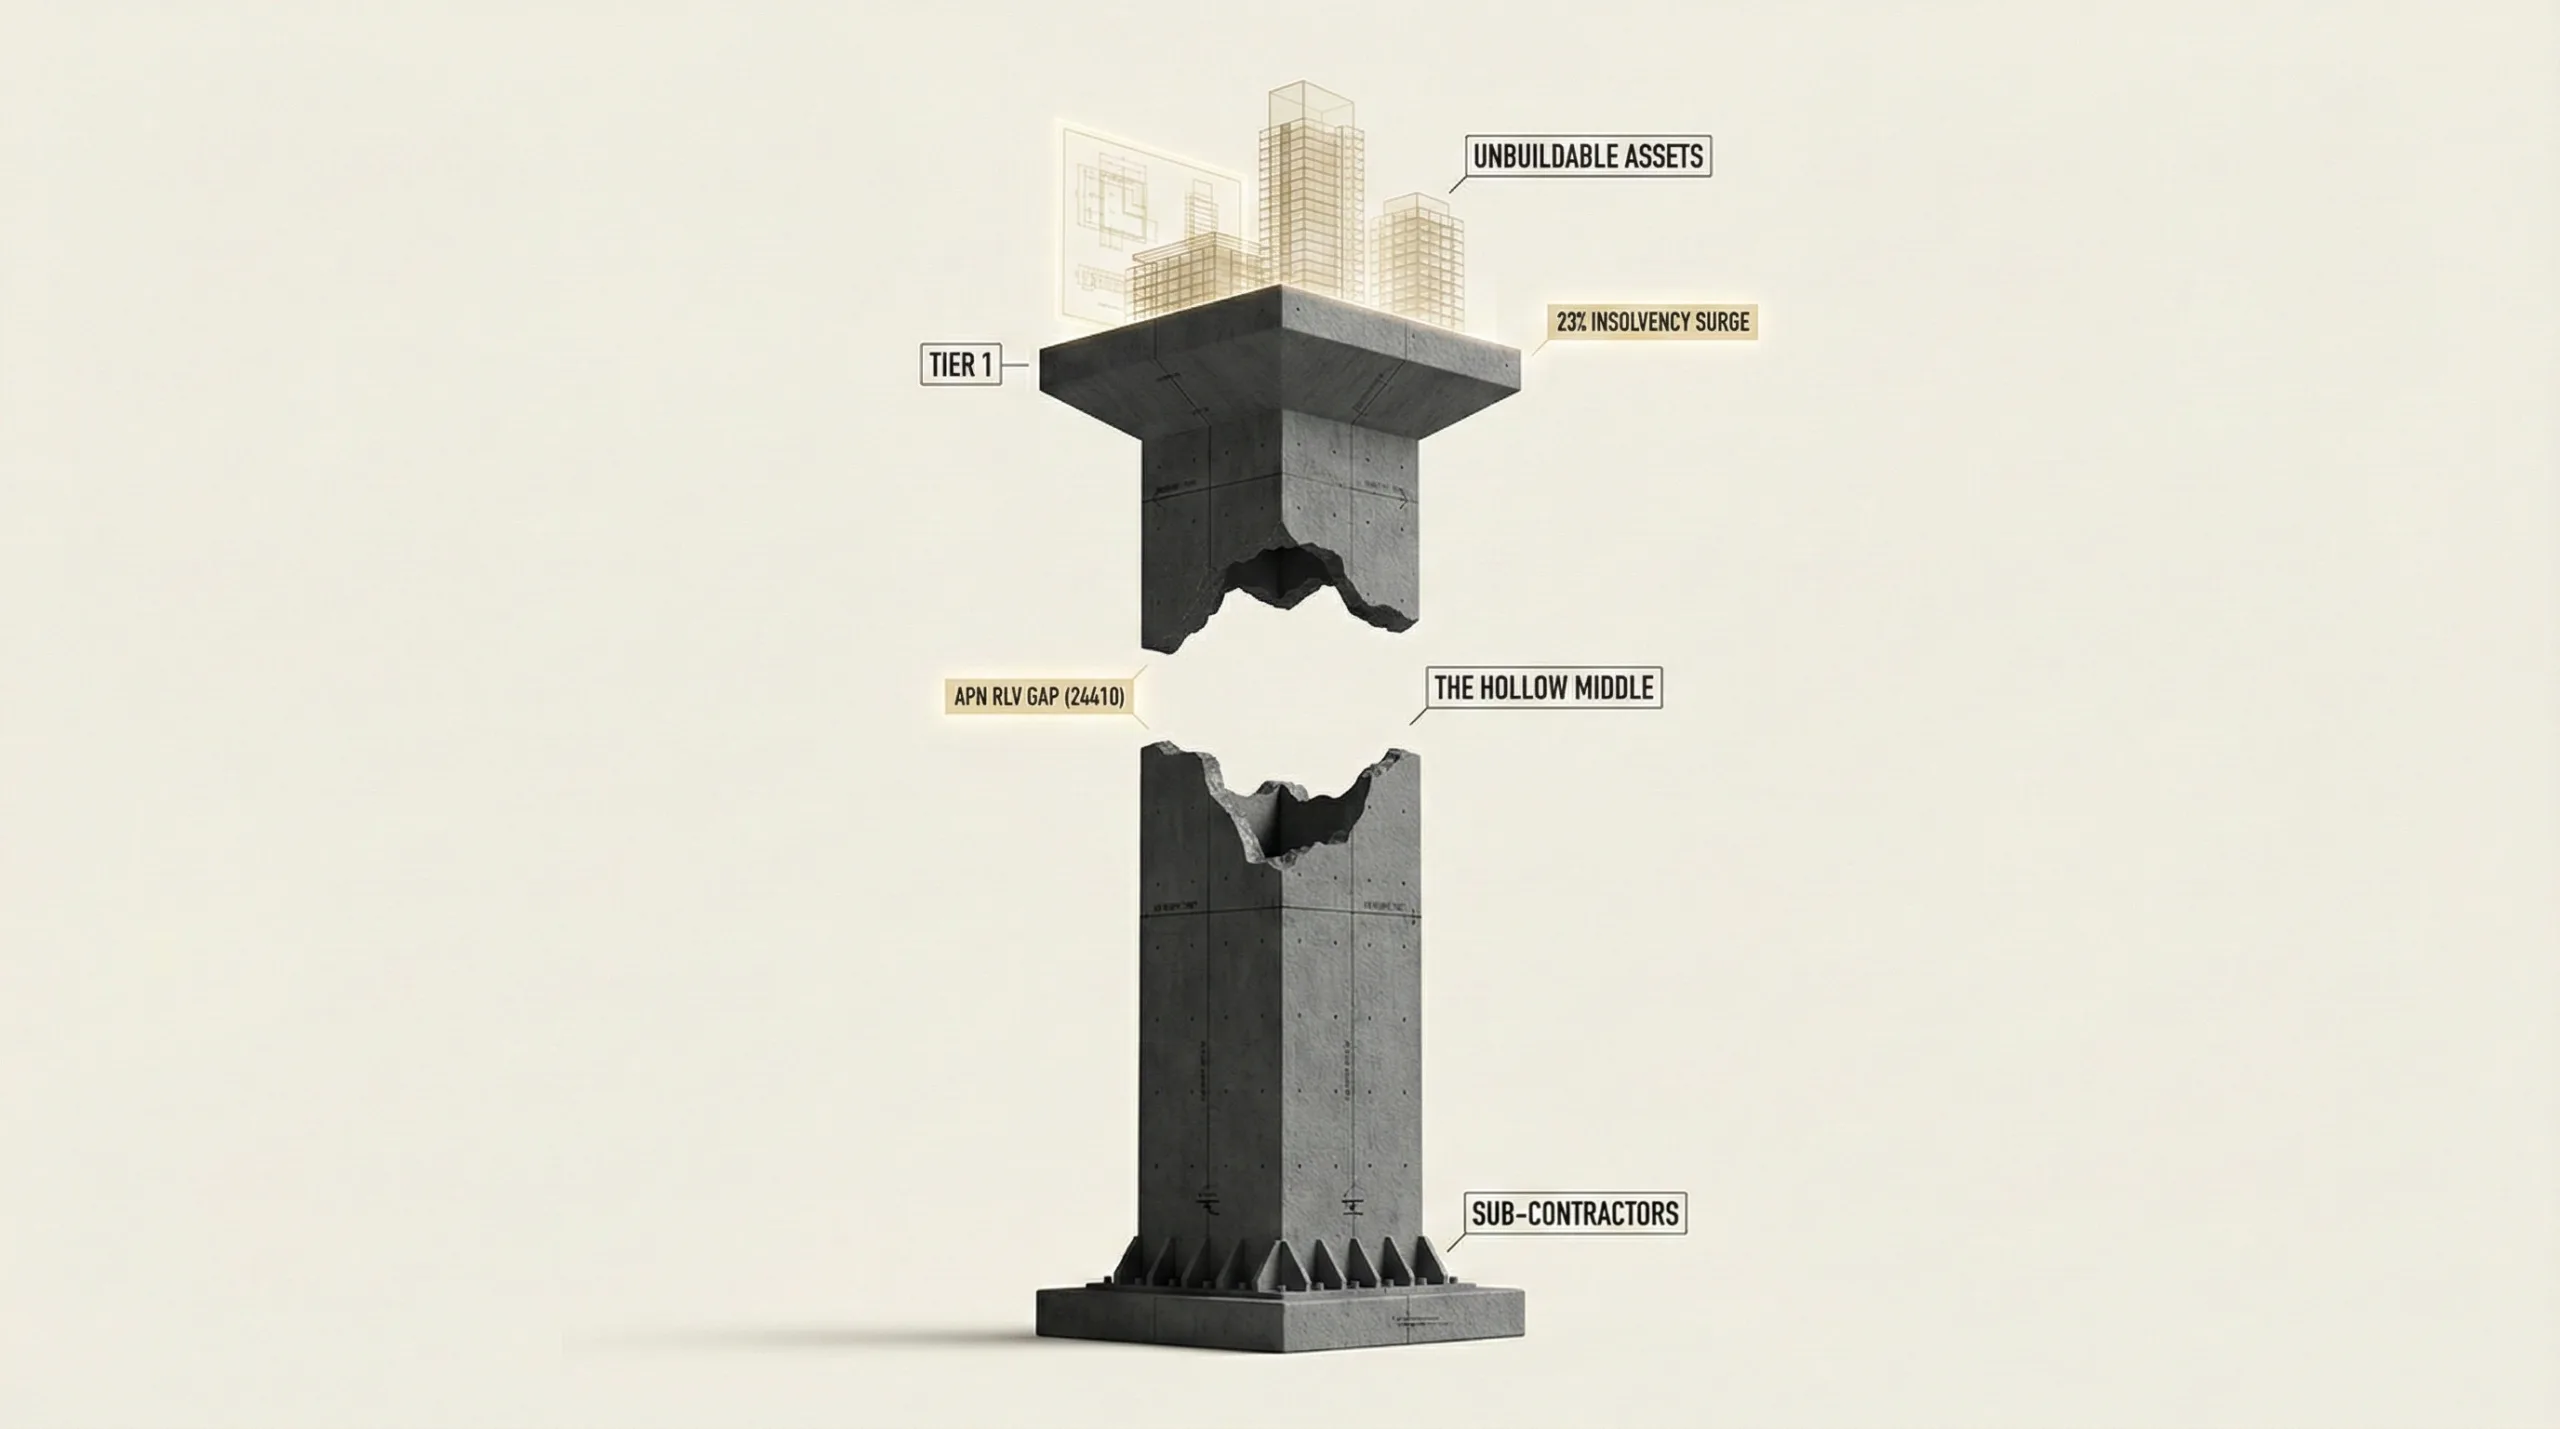
The Australian construction sector has undergone a fundamental structural decoupling, evidenced by a 23% year-on-year material escalation in insolvencies totalling 2,636 failed companies. This is not a cyclical downturn but a permanent erosion of the industry’s delivery capacity, concentrated in the elevated-risk mid-tier and sub-contractor segments. This ‘hollowing out’ has severed the historical link between planning approvals and viable housing supply, creating a new, phantom asset class of ‘approved but unbuildable’ projects. The attrition of the delivery mechanism itself means traditional property forecasting models, which rely on development approvals as a leading indicator, are now mathematically invalid and do not adequately reflect underlying structural conditions.
For property professionals, this paradigm shift invalidates pipeline analysis that does not account for delivery-mechanism failure. The key risk to project viability is no longer just financing costs but the physical unavailability of a solvent builder capable of executing a contract. This creates a bifurcated market where projects contracted to surviving Tier 1 builders or highly-capitalised Tier 2 firms will command a significant premium, while a vast swathe of ‘approved’ projects will remain dormant, constrained in a feasibility gap driven by unpriceable construction risk. Navigating this landscape requires a forensic focus on counterparty solvency and a recalibration of asset values to reflect the real, not theoretical, capacity of the industry to deliver.
Background & Strategic Context
This event validates and calibrates APN’s core macro-theses regarding the primacy of state intervention and the asymmetric distribution of market shocks. The contraction of the construction mid-tier is not a random market failure but a direct consequence of intersecting government policies and predictable economic pressures, confirming that top-down forces are the primary architects of market structure.
The State as Primary Actor (APN Sovereign Policy Composite Index™ (SPCI, 24800)): The insolvency material escalation was directly catalysed by two state actions: the Australian Taxation Office’s resumption of debt recovery post-pandemic, which eliminated highly leveraged entities, and the strategic pivot by state governments to prioritise mega-infrastructure projects. This has absorbed Tier 1 capacity, effectively constraining the private development market of its most reliable delivery partners.
Asymmetric Shock Distribution: This structural pressure point illustrates how market shocks are distributed to create divergent outcomes. Tier 1 contractors have stabilised within the ‘safe harbour’ of government cost-plus contracts, while the mid-tier and sub-contractor ecosystem, exposed to fixed-price contracts and cash-flow pressures, has been materially constrained. This concentrates market power and widens the gap between the industry’s largest players and the contracting middle.
Quantifying Intervention Risk (APN Risk & Compliance Index™ (24200)): The ATO’s decision to end its forbearance policy represents a material increase in the APN Regulatory Velocity Multiplier™ (APN RVM™). This abrupt regulatory action, after a period of artificial life support, demonstrates how an abrupt regulatory policy reversal can trigger systemic capacity destruction far beyond the intended targets.
The Viability Equation Breaks (APN Future Development Pipeline Index™ 24400): The core of the structural pressure point is the rapid expansion of the APN Residual Land Value (RLV) Gap™ (24410). Sustained escalation in risk premiums, labour costs, and supply chain instability have inflated the ‘Construction Cost’ component of the RLV equation to a point where it renders a significant portion of the approved development pipeline financially unviable, turning theoretical assets into dormant liabilities.
Deconstruction of the Source Event
This deconstruction is based on APN’s analysis of the FY25 Construction Insolvency Report, which synthesises regulatory data from ASIC with market intelligence from peak industry bodies and quantity surveyors. The key facts are:
- The 2,636 Failure Event: A verified total of 2,636 construction companies entered external administration in the financial year to March 2025, a 23% year-on-year material escalation. The sector now accounts for 28% of all corporate insolvencies in Australia, confirming it has decoupled from the broader economy.
- The ‘Hollow Middle’ Contraction: The materially adverse impact is asymmetrically concentrated. While Tier 1 contractors have stabilised, the mid-tier (Tier 2 & 3 builders) and specialist sub-contractor markets are in a state of contraction. Over 50% of all failures are sub-contractors, creating a systemic secondary effect that constrains head contractors.
- ‘Shadow Attrition’ of Human Capital: The corporate failure numbers are compounded by a parallel structural pressure point in business-related personal insolvencies. This is permanently removing thousands of experienced, licensed directors and project managers from the industry, creating a materially restrictive effect on its ability to regenerate capacity.
- The ‘Approved but Unbuildable’ Phenomenon: A significant and growing portion of the development pipeline is being shelved not due to a lack of demand or finance, but due to the physical unavailability of a solvent builder. This is explicitly acknowledged by government planning bodies, who now concede that zoning land is structurally ineffective without a functional delivery mechanism.
Critical Analysis & Balanced View
The headline insolvency figure, while notable, masks a deeper and more complex structural transformation. The apparent ‘stabilisation’ of failure rates in some regions is a statistical illusion caused by survivorship bias, there are simply fewer vulnerable companies left to fail. This should not be mistaken for a market recovery. In markets like Western Australia, this creates the paradox of ‘profitless prosperity’, where high demand and revenue coexist with structurally significant failure rates as builders are unable to execute work profitably.
The withdrawal of Tier 1 builders from the private market to the safety of government contracts is a rational, defensive move. However, it creates an oligopolistic environment for major projects and constrains the private sector ecosystem below. This ‘hollowing out’ of the middle is the single greatest structural risk to future housing and commercial supply. While some foreign entities are acquiring distressed mid-tier assets, this appears to be a distressed asset play rather than a genuine expansion of capacity, as new owners often impose stricter risk controls that preclude them from taking on the fixed-price contracts developers require.
The hidden opportunity lies with the well-capitalised, surviving Tier 2 builders and new market entrants who can master the management of a structurally fragmented supply chain. These firms will face diminished competition and will be able to command significant risk premiums. For developers, this structural pressure point will accelerate the capital reallocation toward lower-risk assets, forcing a shift towards more collaborative contracting models and a deeper, more forensic approach to selecting delivery partners.
Strategic Implications for Property Professionals
- For Developers: Your primary project risk has shifted from ‘feasibility’ to ‘deliverability’. A DA approval has negligible value without a secured, solvent construction partner. Re-evaluate your entire pipeline against the APN RLV Gap™ (24410), factoring in elevated construction risk premiums. Prioritise securing a builder with a strong balance sheet over achieving the lowest tender price, as a low bid is now a primary indicator of insolvency risk.
- For Investors & Financiers: Standard due diligence based on pipeline analysis is now no longer structurally viable. Funding approvals must incorporate a forensic assessment of the contracted builder’s solvency, trade credit insurance status, and supply chain stability. The inability to secure multiple competitive tenders is no longer a red flag but the market norm; risk assessment must adapt to this new reality.
- For Agents & Buyers’ Agents: The risk profile of ‘off-the-plan’ property has fundamentally increased. Your advisory must now extend to the delivery risk of the project. Completed stock, or projects under construction by Tier 1 firms, will trade at a significant premium reflecting their certainty of delivery. Use this ‘delivery premium’ as a key selling point.
- For Valuers & Quantity Surveyors: The value of development-approved land without a binding construction contract must be significantly discounted to reflect the ‘unbuildable’ risk and the widened APN RLV Gap™ (24410). Cost planning must now include a specific, substantial contingency for supply chain and builder insolvency risk that goes far beyond traditional escalation allowances.
APN Index Management
The APN Codex 24000 Series is a proprietary set of indices that translates complex market forces into measurable metrics. This section outlines how the preceding analysis is validated against, and informs the calibration of, these frameworks.
- Validation: This analysis provides primary evidentiary validation for the core thesis of the APN Future Development Pipeline Index™ (24400), confirming that ‘zoned capacity’ has structurally decoupled from ‘real capacity’. It validates the APN RLV Gap™ (24410) as the primary financial mechanism driving the ‘approved but unbuildable’ phenomenon. The role of the ATO confirms the direct impact of the APN Regulatory Velocity Multiplier™ (24210) on market structure.
- Index Calibration: The APN Future Development Pipeline Index™ (24400) is recalibrated to apply a 25% ‘Builder Availability Discount’ (BAD) to the total volume of ‘DA Approved’ stock. Projects valued between $50m-$200m will receive an additional 10% ‘Tier 2 elevated risk’ weighting, reflecting their heightened delivery risk. Only projects with a signed, bonded construction contract are counted at full value.
- Data Capture: This analysis triggers a new data capture mandate for the APN Future Development Pipeline Index™ (24400) to track corporate and director-level insolvency rates as a primary input. Furthermore, a new metric tracking ‘tender box failure rates’ (the number of compliant bids per tender) will be captured via the APN Symbiotic Intelligence Network™ (24310) to provide a real-time gauge of delivery capacity.
Disclaimer
The analysis and information contained in this deconstruction are for general informational and strategic purposes only and do not constitute financial, investment, legal, or any other form of professional advice. The Australian Property Network (APN) is a strategic intelligence organisation and is not a licensed financial advisor.
This analysis is based on data and information from third-party sources believed to be reliable; however, APN provides no warranty as to its accuracy, currency, or completeness. Images used in this analysis are for illustrative and conceptual purposes only and may not represent real persons, properties, or events.
All frameworks (Codex 24100-24800) are proprietary to APN.
Property values and market conditions can go up or down. Before making any property or investment decisions, you must conduct your own thorough research and seek independent professional advice tailored to your specific circumstances.