Analysis of 15-Year Baseline Reveals Convergent Trajectories in Investor Concentration and Market Momentum
APN ANALYSIS: A-260403-AUS138758
This is an APN structured analytical synthesis derived from institutional data inputs processed under APN Codex Nodes 21610 (Investor vs. Owner-Occupier Behaviour) and 21620 (Market Psychology & Behavioural Analysis), representing 2 of 8 subordinate nodes within the 21600 Market Sentiment & Behavioural Analysis series. The complete publication, including full node architecture, baseline calibration, and subordinate node deconstructions, is available at the APN Research page.
Executive Summary
A 15-year analysis of Australian residential property data from 2011 to 2025 provides empirical support for the APN framework’s foundational position that the market cannot be treated as a single, homogeneous entity. The synthesis of APN’s analytical indices reveals that the market’s highest behavioural momentum events — as measured by the APN Behavioural Momentum Index™ (BMI) via the Behavioural Momentum Metric (BMM), an input-based metric derived from APN Codex Node 21620 — occurred when the Investor Concentration Ratio (ICR) was at its lowest. This confirms that market-wide acceleration and elevated levels of yield-seeking capital are not the same condition and can operate in opposition.
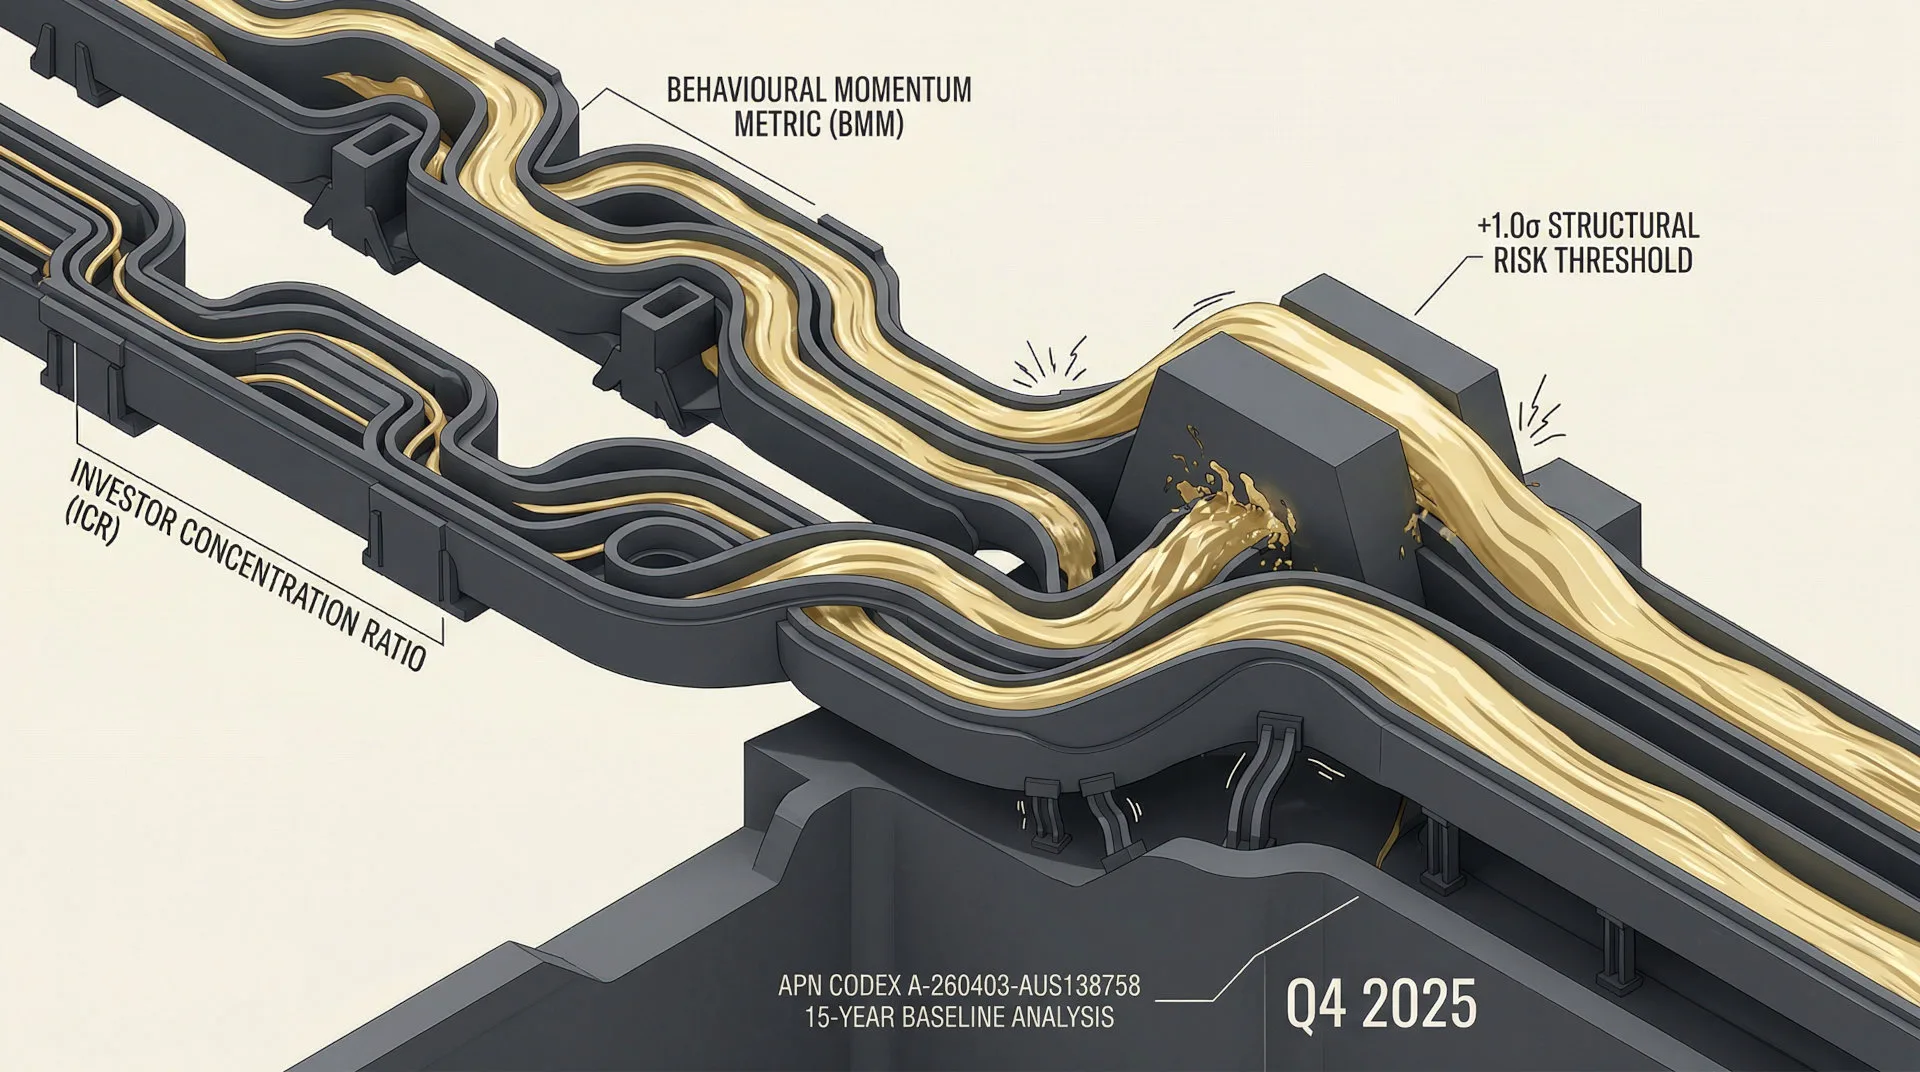
For property professionals, this analysis provides a critical framework for diagnosing market health beyond headline price movements. At the terminal point of the analysis in Q4 2025, both investor concentration and behavioural momentum were converging towards a +1.0 standard deviation structural risk threshold. This synchronised trajectory elevates the structural risk of targeted regulatory intervention, requiring professionals to differentiate between cohort-driven risks and assess capital allocation strategies accordingly.
Background & Strategic Context
This analysis validates and calibrates APN’s core macro-thesis that cohort-specific behaviour, rather than aggregated market data, is the primary leading indicator of systemic risk and regulatory response. The synthesis of investor concentration and behavioural momentum provides an empirical foundation for modelling how regulatory friction is transmitted and how different capital sources respond to policy shifts, moving beyond the limitations of traditional fundamental analysis.
Investor Concentration Ratio (ICR) (21610): This input-based metric mathematically isolates the proportion of new lending attributable to investors versus owner-occupiers. It serves as the primary measure of the market’s reliance on more elastic, yield-seeking capital, which exhibits higher sensitivity to policy adjustments and macroprudential friction.
Behavioural Momentum Metric (BMM) (21620): This input-based metric quantifies the compounding acceleration or deceleration of transactional behaviour relative to baseline pricing shifts. It provides an empirical measure of cohort-level transactional momentum, capturing what participants are doing, distinct from what sentiment surveys suggest they are feeling. The BMM feeds directly into the relevant APN 24000 Series proprietary index as a calibration input.
APN Risk & Compliance Index™ (24200): This analysis provides direct inputs for this index, which models the structural risk of macroprudential intervention. The framework confirms that this risk increases proportionally as cohort concentration (ICR) and behavioural momentum (BMM) converge on established risk thresholds.
Deconstruction of the Source Event
This deconstruction is based on an APN Codex Synthesis, which integrates 15 years of Tier-1 institutional data from the Australian Bureau of Statistics (ABS), the Reserve Bank of Australia (RBA), and the Australian Prudential Regulation Authority (APRA). The key facts are:
- Cohort Inversion During Peak Momentum: The two highest BMI readings in the 15-year baseline (+5.441σ in Q3 2019 and +3.057σ in Q4 2020) occurred while the ICR was in negative territory (−1.288σ and −2.317σ, respectively). This confirms the market’s most significant behavioural surges were driven by owner-occupiers, not yield-seeking capital.
- Structural Stasis Misread as Price Stability: In Q3 2022, during a major monetary tightening cycle, a positive BMI reading (+1.227σ) coincided with sharp quarterly declines in both price (−3.33%) and transaction velocity (−11.35%). The BMI correctly diagnosed a market constrained by inventory withdrawal, a condition where standard price indices recorded only a fractional adjustment.
- Asymmetric Leverage Capacity Confirmed: At Q4 2025, new investor loans with a debt-to-income (DTI) ratio of six or more constituted 11.3% of investor lending, compared to just 4.0% for owner-occupiers. This 2.83x differential empirically confirms that the investor cohort deploys capital under structurally different financial constraints.
- Convergent Risk Trajectory at Terminal Point: At the end of the analysis period (Q4 2025), both the BMI (+0.847σ) and the ICR (+0.8307σ) were simultaneously approaching the +1.0σ structural risk threshold. This synchronous convergence signals a compounding build-up of systemic risk. The regulatory intervention of February 2026 serves as out-of-sample validation of the risk framework, having followed directly from the convergence identified at the terminal point of this analysis.
Critical Analysis & Balanced View
The first critical insight is the cohort inversion condition. The analysis demonstrates that the market can generate extreme behavioural momentum without its most leveraged cohort. While momentum driven by owner-occupiers might appear fundamentally more stable, the data indicates it is often a product of powerful but temporary government stimulus — such as the HomeBuilder programme — and accommodative monetary conditions. This form of momentum can be less durable and more sensitive to policy withdrawal than investor-led cycles, which are governed by incumbent equity and yield calculations. A distinct form of systemic risk therefore emerges: the market becomes structurally dependent on continued state support rather than organic capital formation.
A second-order insight emerges from the structural stasis event of Q3 2022. The divergence between the BMI and standard price indices reveals that price is a lagging and potentially misleading indicator of market health during tightening cycles. The mechanism identified is that incumbent asset holders, facing serviceability constraints that prevent re-entry into the market, can establish an inventory-withdrawal price floor by withdrawing supply rather than accepting lower prices. This suppresses observable demand signals and delays price discovery, creating latent risk of a price adjustment of greater magnitude should a liquidity event compel distressed sales into a market with suppressed transaction volumes.
Strategic Implications for Property Professionals
- For Developers: A rising ICR, even with a stable BMI, signals growing investor appetite, which can support the feasibility of investment-grade stock. However, it also increases the project’s sensitivity to macroprudential rules targeting investors. Conversely, a high BMI with a low ICR indicates demand is concentrated in the owner-occupier segment, requiring product tailored to that cohort’s borrowing capacity and price point.
- For Lenders & Brokers: The confirmed 2.83x differential in high-DTI lending between cohorts is a key risk indicator. As the ICR rises, the aggregate risk profile of new loan origination shifts. Monitoring the ICR provides a leading indicator of when regulators are likely to impose cohort-specific lending caps or serviceability adjustments, as occurred in February 2026.
- For Valuers & Analysts: Relying solely on price indices can be misleading. The BMI provides a necessary cross-reference to determine whether price stability reflects genuine demand-supply equilibrium or a supply-constrained market stasis. Valuations in low-volume markets should be adjusted to reflect the risk associated with suppressed transaction velocity.
- For Investors: The analysis confirms that investor participation is a primary focus of macroprudential policy. The ICR acts as a barometer for regulatory risk. As the ICR approaches and exceeds the +1.0σ threshold, the structural risk of targeted intervention increases, indicating a need to model policy friction into acquisition and exit strategies.
APN Index Management
The APN Codex 24000 Series is a proprietary set of indices that translates complex market forces into measurable metrics. This section outlines how the preceding analysis is validated against, and informs the calibration of, these frameworks.
- Validation: This analysis validates the APN Risk & Compliance Index™ (24200) by empirically demonstrating that elevated ICR and BMI Z-Scores precede targeted macroprudential interventions, as observed prior to the regulatory actions of 2015, 2017, and February 2026 — the last of which constitutes out-of-sample validation of the convergence identified at the terminal point of this analysis.
- Index Calibration: The APN Credit Rationing Index™ (24230) is calibrated using the confirmed 11.3% vs 4.0% high-DTI lending differential between investor and owner-occupier cohorts, refining the model for how rising investor concentration structurally displaces income-constrained buyers.
- Index Calibration: The APN Residual Land Value Gap™ (24410) function is adjusted to reflect the finding that a rising ICR allows developers to project higher investor absorption rates, which can inflate Gross Realisation Value assumptions and compress the RLV Gap for projects aimed at other cohorts.
Disclaimer
The analysis and information contained in this deconstruction are for general informational and strategic purposes only and do not constitute financial, investment, legal, or any other form of professional advice. The Australian Property Network (APN) is a strategic intelligence organisation and is not a licensed financial advisor.
This analysis is based on data and information from third-party sources believed to be reliable; however, APN provides no warranty as to its accuracy, currency, or completeness. Images used in this analysis are for illustrative and conceptual purposes only and may not represent real persons, properties, or events.
All frameworks (Codex 24100-24500) are proprietary to APN.
Property values and market conditions can go up or down. Before making any property or investment decisions, you must conduct your own thorough research and seek independent professional advice tailored to your specific circumstances.
Findings are presented on the basis of data and evidence alone.