The Delivery Desert: Why Australia’s Housing Targets Are Mathematically Impossible
APN ANALYSIS: A-260228-AUS137796
Executive Summary
The Australian residential property market is operating within a structural ‘Delivery Desert’, a systemic failure of the construction sector that renders government housing targets mathematically impossible. An unprecedented wave of construction insolvencies, coupled with severe input cost shocks like the 16.5% surge in copper prices, has severed the link between planning approvals and physical completions. While dwelling approvals rose 12.8% in 2025, actual completions have stagnated, resulting in a quarterly deficit of approximately 15,758 homes against the National Housing Accord’s mandated target. This is not a cyclical downturn; it is a permanent fracture in the nation’s delivery capacity, driven by extreme execution risk and collapsing contractor margins.
For property professionals, this structural supply failure is creating a profound and durable scarcity premium for existing, completed housing stock. The extreme risk, cost, and delay associated with new builds are funnelling capital and buyer demand towards the safety of tangible, risk-free assets. The ‘Replacement Cost Gap’, the chasm between the price of an existing home and the exorbitant cost to build a new one, has become the market’s most critical valuation metric. Capital allocation must now prioritise the certainty of completed dwellings over the theoretical promise of off-the-plan projects, as execution risk is now the single largest determinant of asset value.
Background & Strategic Context
This analysis validates and calibrates APN’s core macro-thesis, ‘The Supply Illusion’, which posits that government housing targets are entirely theoretical, whereas construction reality is dictated by mathematical and financial constraints. The widening chasm between political intent and physical delivery is not a temporary market anomaly but a structural feature of the current economic landscape, driven by a convergence of corporate distress, material scarcity, and unsustainable cost escalation.
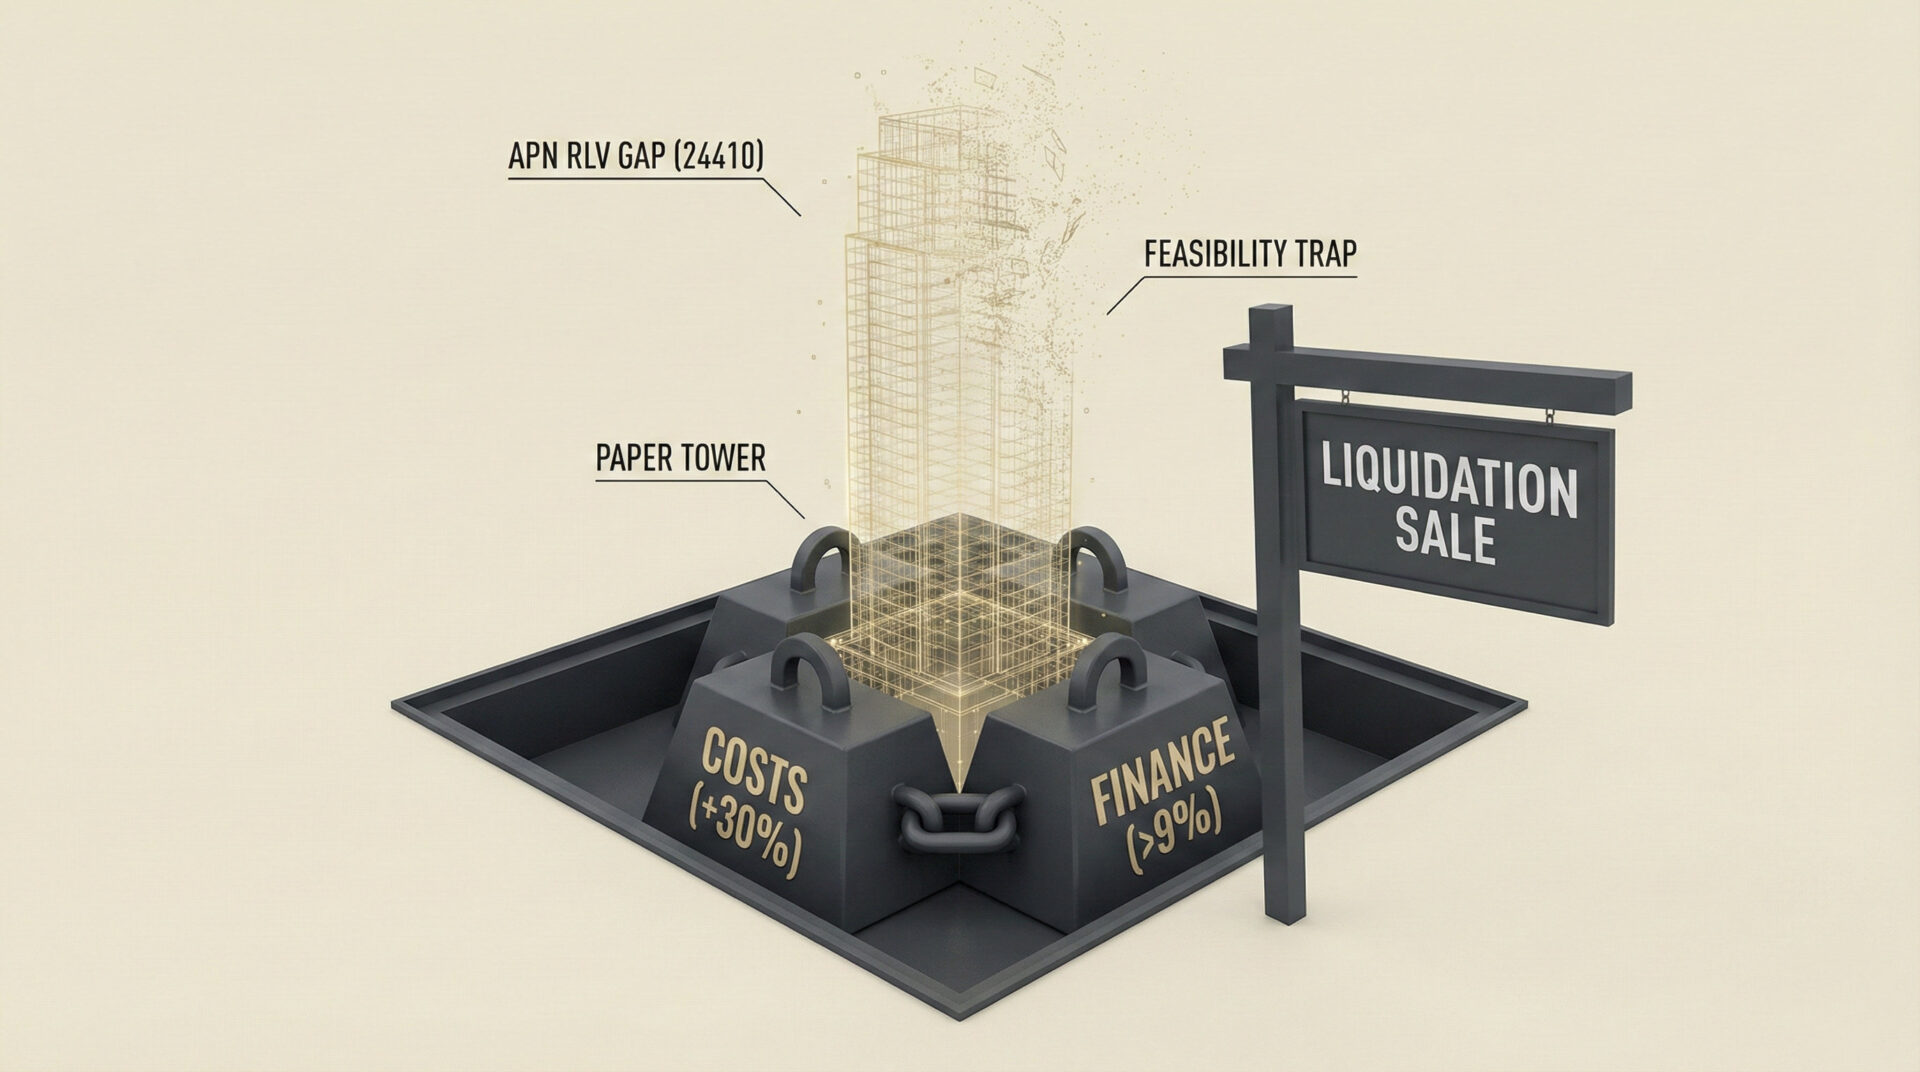
The Viability Filter (APN Future Development Pipeline Index™): The celebrated 12.8% lift in dwelling approvals is a strategically meaningless metric without being filtered for economic viability. The index demonstrates that a significant portion of these approvals are merely ‘Paper Rezonings’, projects that are legally permitted but financially unfeasible to construct due to insurmountable costs, rendering them worthless as a contribution to physical housing supply.
The Execution Deficit (The Supply Illusion): The core of the current crisis is the disconnect between planning intent and physical execution. The National Housing Accord’s target of 60,000 completions per quarter is being catastrophically missed, with the industry struggling to deliver just over 44,000. This proves that households cannot live in an approval; the physical capacity to build has been dismantled by a relentless cycle of corporate failure and cost shocks.
The Viability Chasm (APN Residual Land Value (RLV) Gap™): Soaring construction costs and contractor risk premiums have blown out the financial feasibility of new developments. This widening RLV Gap means developers cannot pay speculative land prices and still deliver a profitable project. The result is a surge in project abandonments, with developers holding approved sites that are mathematically impossible to build, directly feeding the ‘Paper Rezonings’ phenomenon.
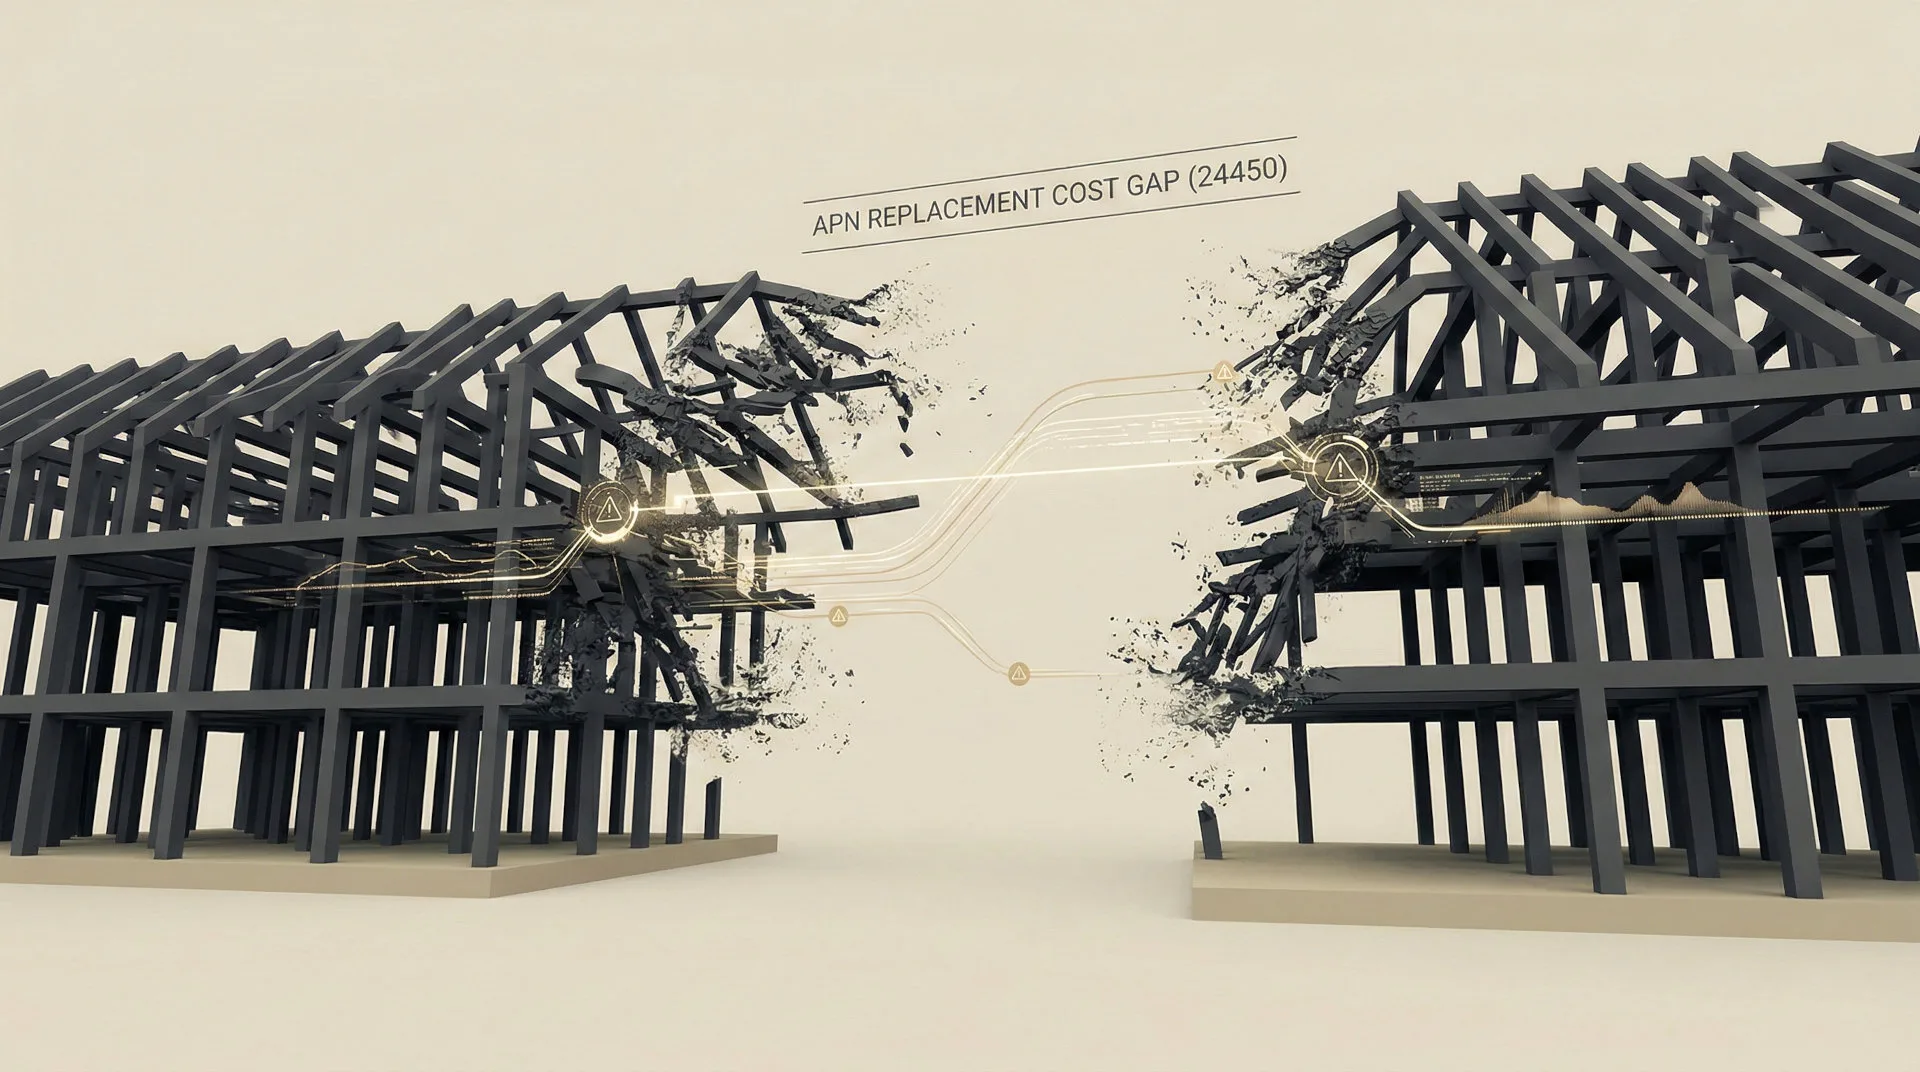
The Scarcity Moat (APN Replacement Cost Gap™): The construction sector’s inability to deliver new supply at viable cost has created a powerful valuation moat around existing, completed dwellings. Because it is structurally impossible to replicate an existing asset at its historical cost, buyers are paying a significant premium for the certainty of a finished product, completely bypassing the extreme counterparty and execution risk of the new-build market.
Deconstruction of the Source Event
This deconstruction is based on APN’s analysis of empirical data from the Australian Securities and Investments Commission (ASIC), the Australian Bureau of Statistics (ABS), Altus Group, Rider Levett Bucknall (RLB), and CreditorWatch. The key facts are:
- Insolvency Catastrophe: The construction sector recorded 1,894 corporate insolvencies in the financial year to 10 February 2026, continuing a trend in which the sector accounted for 27% of all national business failures in the preceding year. This represents the most destructive insolvency cycle in Australia’s recorded history.
- Critical Input Shock: The price of copper, an essential late-stage construction material, surged 16.5% year-on-year, surpassing US$13,000 per tonne in early 2026. This is driven by structural global demand from AI data centres and EV manufacturing, directly attacking the viability of fixed-price contracts for electrical and mechanical trades.
- Execution Deficit: Despite a 12.8% rise in dwelling approvals in 2025, physical completions fell to just 44,242 in the September 2025 quarter. This is a shortfall of ~15,758 dwellings against the 60,000 quarterly completions required to meet the National Housing Accord target.
- Sustained Cost Escalation: Tender prices are forecast to rise by 5.0% in Brisbane and 5.5% on the Gold Coast in 2026. This is on top of a massively inflated cost base, with forecasts of further acceleration to 7.0% annually from 2027 to 2029 in South-East Queensland.
- Project Abandonment Surge: Reflecting the collapse in project viability, the residential project abandonment rate in Victoria hit 8.6% in Q3 2024. This metric provides definitive proof that a large percentage of approvals will never convert to physical housing stock.
Critical Analysis & Balanced View
The prevailing narrative, which equates rising approvals with future supply relief, is a dangerous analytical error. The data confirms a structural decoupling, which the friction of builder insolvency, capital starvation, and material cost shocks prevents planning intent from translating into physical reality. The 1,894 insolvencies are not just statistics; each failure acts as a contagion vector, stranding multiple projects and creating liquidity traps for otherwise solvent contractors.
The 16.5% copper price shock is a critical case study. It is not a cyclical spike but a structural repricing driven by global megatrends. Its impact is magnified because it hits late in the construction cycle, bankrupting subcontractors locked into outdated fixed-price agreements. This dynamic has forced the death of the traditional procurement model, replaced by an environment where developers must pay massive, non-negotiable risk premiums to secure a financially resilient builder.
Furthermore, the tender price escalation in hotspots like South-East Queensland is being entrenched by major public infrastructure projects absorbing finite labour and materials. This ‘crowding out’ effect ensures that private residential development remains prohibitively expensive, destroying the feasibility of marginal projects needed to meet housing targets. The market has permanently shifted; risk, not price, is now the primary driver of procurement, and this has fundamentally altered the valuation landscape in favour of existing, completed assets.
Strategic Implications for Property Professionals
- For Developers: The era of speculative land banking based on zoning uplift is over. Viability is now dictated by execution capacity. Strategic focus must shift to de-risking the delivery chain through joint ventures with financially robust Tier 1 builders, adopting open-book/cost-plus contracts, and securing forward supply agreements for critical materials. Projects without a secured, solvent builder are effectively worthless.
- For Investors & Buyers’ Agents: The ‘Completed-New’ asset class now carries a significant, justifiable scarcity premium. Capital should be rotated away from off-the-plan projects, which carry unquantifiable counterparty and completion risk. Focus on acquiring tangible, certified, and grid-connected properties that are insulated by the APN Replacement Cost Gap™. The primary source of capital growth in this market is the construction sector’s inability to compete with existing stock.
- For Lenders & Financiers: Underwriting standards must evolve beyond project-level GRV and pre-sales. The primary assessment must be a rigorous, forensic analysis of the nominated head contractor’s balance sheet, supply chain stability, and exposure to fixed-price contracts. The B2B Invoice Default Velocity of a builder is now a more critical leading indicator of project success than the number of units pre-sold.
- For Valuers: The ‘cost approach’ to valuation for new developments is fundamentally broken. Valuations must now explicitly quantify and price ‘execution risk’. The differential between an off-the-plan asset and an identical completed dwelling (the ‘certainty premium’) must be mathematically defined and incorporated into valuation reports to reflect the high probability of cost overruns, delays, and builder failure.
APN Index Management
The APN Codex 24000 Series is a proprietary set of indices that translates complex market forces into measurable metrics. This section outlines how the preceding analysis is validated against, and informs the calibration of, these frameworks.
- Validation: This analysis provides definitive validation for ‘The Supply Illusion’ macro-thesis. The catastrophic divergence between the 195,731 annual approvals and the sub-180,000 annualised completion rate empirically proves the structural disconnect between planning intent and physical delivery.
- Index Calibration (APN Future Development Pipeline Index™ – 24400): The index’s ‘Friction Filter’ is recalibrated to more heavily weight contractor insolvency risk and critical material price volatility. The 8.6% project abandonment rate in Victoria provides a new, hard benchmark for discounting the value of ‘Paper Rezonings’ within the pipeline.
- Index Calibration (APN Replacement Cost Gap™ – 24450): The index is calibrated to reflect the compounding effect of sustained tender price escalation (5.0-5.5%) on top of the already-inflated 2022-2025 cost base. This widens the measured ‘Gap’, increasing the calculated scarcity premium for existing stock.
- Data Capture: This analysis triggers a new data capture mandate to integrate real-time B2B invoice default data as a primary input for the APN Supply Chain Strain Index™ (24430). This will allow for predictive modelling of insolvency clusters and their geographic impact on the development pipeline.
Disclaimer
The analysis and information contained in this deconstruction are for general informational and strategic purposes only and do not constitute financial, investment, legal, or any other form of professional advice. The Australian Property Network (APN) is a strategic intelligence organisation and is not a licensed financial advisor.
This analysis is based on data and information from third-party sources believed to be reliable; however, APN provides no warranty as to its accuracy, currency, or completeness. Images used in this analysis are for illustrative and conceptual purposes only and may not represent real persons, properties, or events.
All frameworks (Codex 24100-24600) are proprietary to APN.
Property values and market conditions can go up or down. Before making any property or investment decisions, you must conduct your own thorough research and seek independent professional advice tailored to your specific circumstances.