Project Iron Gate Implemented: RBA Rate Hike and APRA DTI Rules Trigger Structural Credit Constraint
APN ANALYSIS: A-260228-AUS137777
Executive Summary
The Australian macroeconomic landscape has undergone a structural shift in the first quarter of 2026. The expiration of government energy rebates revealed a persistent, structural inflation floor, with core inflation accelerating and headline electricity costs increasing by 32.2%. This prompted a dual-pronged policy response: the Reserve Bank of Australia (RBA) hiked the official cash rate to 3.85%, and the Australian Prudential Regulation Authority (APRA) implemented a restrictive debt-to-income (DTI) cap, materially restricting high-leverage lending. This convergence of monetary and macroprudential forces has triggered a structural ‘Credit Constraint’, structurally excluding a significant portion of the population—primarily wage-reliant aspirants—from the property market and fundamentally altering the architecture of access to capital.
For property professionals, this fundamental change redefines the entire competitive landscape. The market is no longer an unconstrained environment where income and ambition can secure entry; it has become an equity-dominated ecosystem. The primary driver of acquisition capacity has shifted from borrowing power based on income to deploying existing capital. This systematically constrains leveraged competition among incumbent asset holders, concentrates purchasing power, and channels the remaining high-DTI capital into specific, state-sanctioned asset classes, such as new construction. Success in this new environment is now dictated less by finding buyers and more by securing access to the diminishing pool of viable, low-DTI capital.
Background & Strategic Context
This sequence of events provides empirical validation for APN’s core macroeconomic theses, demonstrating how state-led interventions are now the primary force shaping market outcomes. The collision of fiscal, monetary, and regulatory policy has not been accidental; it is the systematic implementation of a new regime that prioritises systemic stability over individual economic mobility, structurally influencing market access.
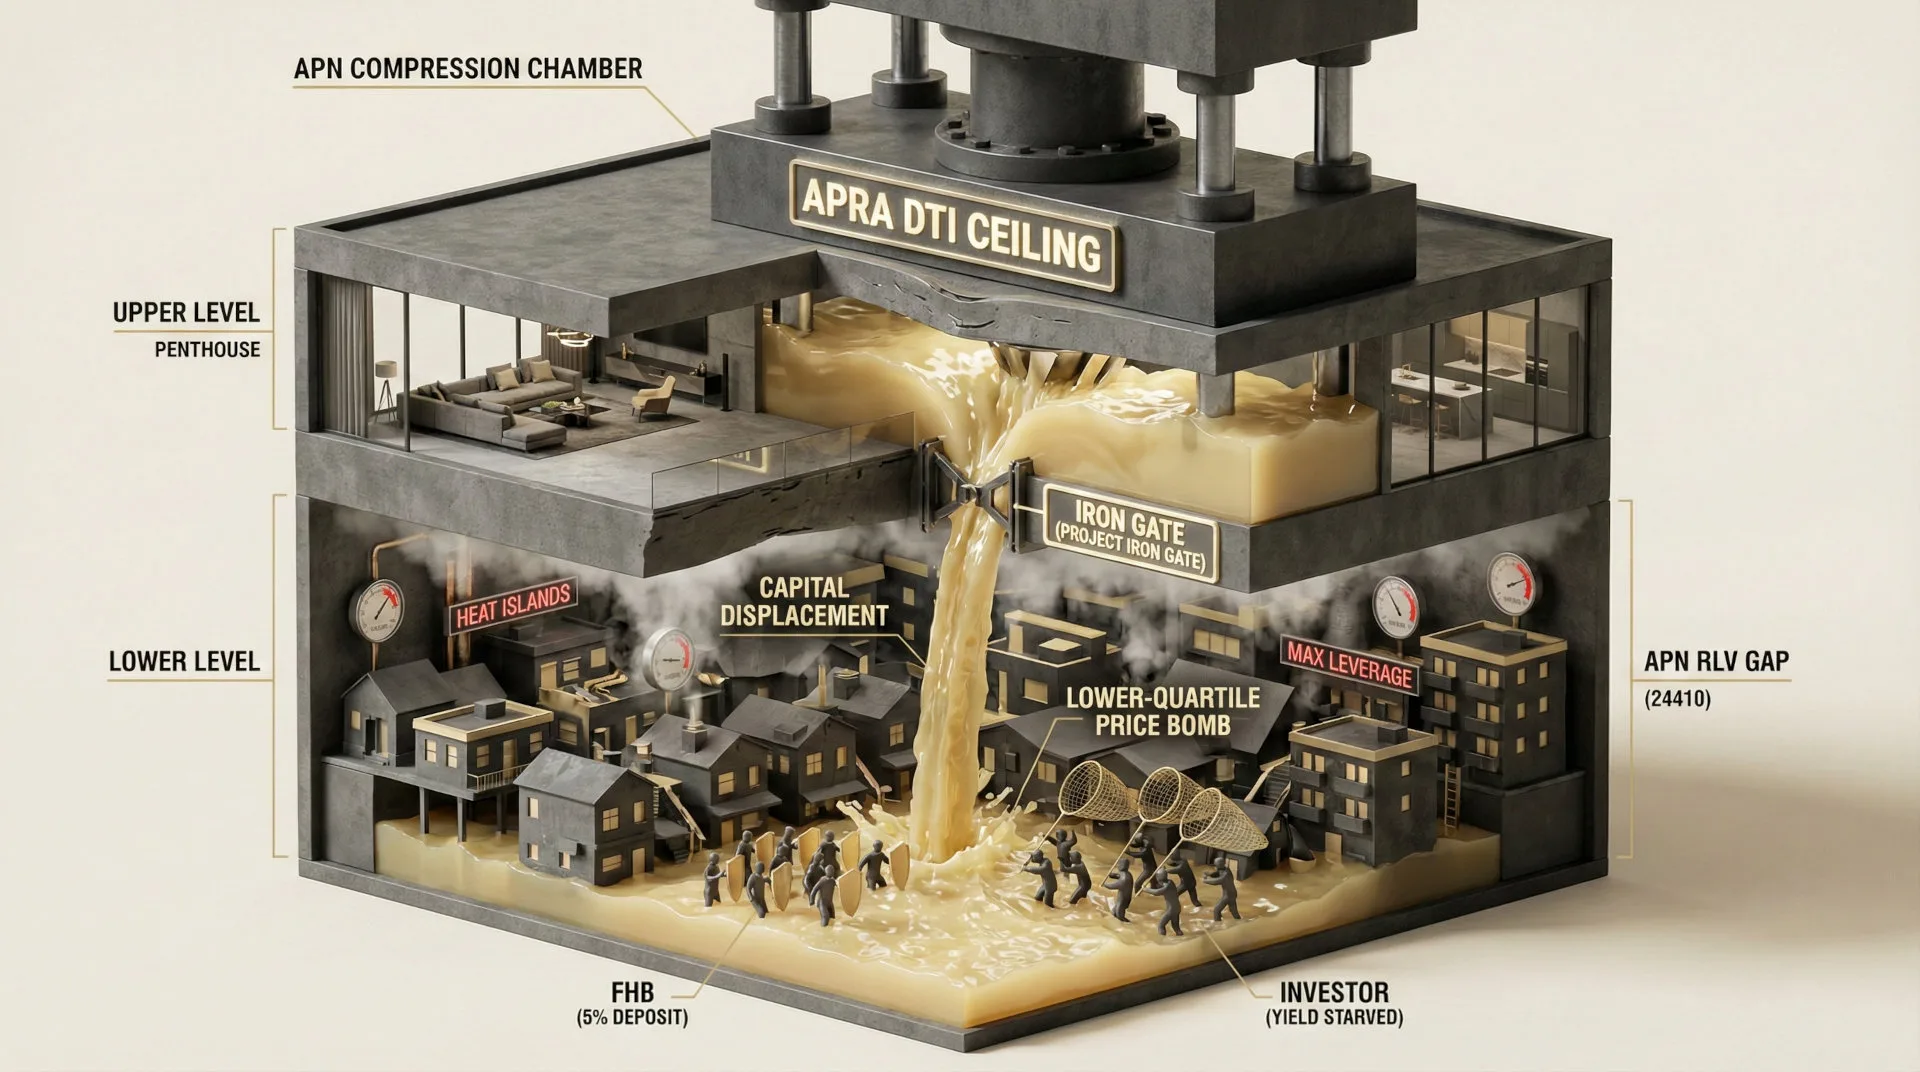
Credit Rationing & Equity Barriers (Project Iron Gate): The simultaneous RBA rate hike and the implementation of the APRA DTI cap are the primary mechanisms of Project Iron Gate. By raising the serviceability floor to near 9.5% while capping high-DTI loans at 20% of a bank’s portfolio, regulators have constructed a structural barrier. This gate rations credit not on a borrower’s capacity to earn, but on their pre-existing asset position, shifting the market from an income-leveraged to an equity-dominated system.
The Development Insolvency Gap (The Supply Illusion): The Structural Credit Constraint directly validates The Supply Illusion. With construction insolvencies already at levels indicating a structural pressure point (24% of all corporate failures), the material reduction of high-leverage credit for both developers and buyers makes government housing targets structurally unachievable. The widening Residual Land Value (RLV) Gap ensures that theoretical rezoning announcements do not translate into physical supply, thereby hardening the value of existing stock.
Socio-Economic Stratification (APN Net State Position™): This new environment reinforces the five-tier cohort structure. Tier 1 (Architects) and Tier 2 (Extractors) who possess incumbent equity are structurally advantaged, face less competition, and have unconstrained access to capital. Conversely, Tier 4 (The Host) and Tier 5 (The Inventory), who rely on PAYG income, are structurally excluded by the DTI cap, their Net State Position degrading as they are excluded from asset ownership and are positioned to fund the system that excludes them.
Deconstruction of the Source Event
This deconstruction is based on APN’s analysis of macroeconomic data from the Australian Bureau of Statistics (ABS), the Reserve Bank of Australia (RBA), and the Australian Prudential Regulation Authority (APRA) for the first quarter of 2026. The key facts are:
- The Rebate Cliff Effect: January 2026 CPI data revealed that headline inflation remained at 3.8%, contrary to expectations of a continued fall. The primary driver was a 32.2% year-on-year increase in electricity prices, directly attributed by the ABS to the cessation of Commonwealth and State energy rebates. This revealed the true, unsubsidised inflation floor.
- The Monetary Response: In response to accelerating core inflation (up to 3.4%), the RBA executed a 25-basis-point rate hike on February 3, 2026, raising the official cash rate to 3.85%. The Board explicitly cited sticky inflation and stronger-than-expected demand, signalling rates would remain higher for longer.
- The Public-Private Wage Divergence: December 2025 quarter data confirmed a structural adjustment in the labour market. Public-sector annual wage growth increased to 4.0%, driven by state enterprise agreements, while the private sector, most exposed to monetary tightening, decelerated to 3.4%. This state-led stimulus directly counteracts the RBA’s demand-cooling objectives.
- The APRA DTI Activation: Effective February 1, 2026, APRA mandated that banks must limit new mortgages with a debt-to-income (DTI) ratio of six or more to just 20% of their quarterly lending. This portfolio cap acts as a firm quota, forcing banks to systematically decline otherwise creditworthy, high-DTI applicants.
Critical Analysis & Balanced View
The mainstream narrative posits that the Q1 2026 inflationary pressure is a transitory event that the RBA’s rate hike will quickly contain, allowing for a policy pivot later in the year. This Null Hypothesis is not supported by underlying structural data. The Australian economy is not experiencing a cyclical anomaly; it is undergoing a structural adjustment, and the RBA is constrained by a policy paradox that precludes any near-term relief.
The private sector is contracting under the weight of state-led policy. Corporate insolvencies are at structurally significant levels, increasing 33% year-on-year, with the foundational construction sector representing the primary locus of the structural pressure point. Simultaneously, the labour market is being structurally altered, with 85% of all net job creation over the past year generated by the non-market public sector. The private sector, the primary driver of economic growth, is creating jobs at a near-recessionary rate of just 0.6%.
This creates a structural dilemma for the RBA. It cannot cut rates to support the private sector experiencing material deterioration without reigniting the very inflation it is mandated to contain, an inflation exacerbated by 4.0% public-sector wage hikes and accelerated public sector hiring. Therefore, the RBA is structurally compelled to maintain a restrictive policy stance, with secondary consequences for the private sector, to contain public-sector-driven inflation. This ensures the 3.85% cash rate and the APRA DTI limits will remain as a permanent, structural feature of the market, not a transitory condition.
Strategic Implications for Property Professionals
- For Developers: The APRA exemption for new dwelling construction creates a constrained market of high-DTI buyers who have no other path to credit. However, securing project finance will become materially more difficult as lenders de-risk their own books. The widening RLV Gap and construction insolvencies mean only the most well-capitalised developers will be able to execute, creating a supply-side oligopoly.
- For Agents & Buyers’ Agents: The client base has been clearly bifurcated. Transaction velocity will now be dominated by equity-rich, sub-6 DTI clients who are pre-approved and face minimal competition. The Tier 4/5 aspirant market is effectively structurally static. Your focus must shift from lead generation to capital qualification; the key question is no longer ‘can they afford the repayment?’ but ‘do they fit within our bank’s DTI quota?’.
- For Mortgage Brokers & Lenders: The 20% high-DTI quota is now a scarce and valuable resource to be allocated strategically to the most profitable, long-term clients. This transforms the lending process from a volume game to a complex portfolio management exercise. Non-bank lenders, exempt from the cap, will see accelerated growth in demand from excluded borrowers, but at a significant price premium.
- For Investors: A distinction is now drawn between incumbent, low-leverage investors and aspiring, high-leverage newcomers. Those with substantial existing equity will benefit from a market with structurally fewer buyers, reduced price pressure from leveraged bidders, and preferential access to credit. Portfolio expansion for those reliant on high DTI ratios is now structurally unachievable in prime markets.
APN Index Management
The APN Codex 24000 Series is a proprietary set of indices that translates complex market forces into measurable metrics. This section outlines how the preceding analysis is validated against, and informs the calibration of, these frameworks.
- Validation: This analysis provides empirical validation for the core theses of Project Iron Gate and The Supply Illusion. It further validates the operational mechanics of the APN Net State Position™ (24600), demonstrating the market is now segmented by capital access, not income.
- Index Calibration (APN Credit Rationing Index™ – 24230): The index is calibrated to quantify the exclusion rate of PAYG-reliant borrowers (Tier 4/5) under the new 3.85% cash rate and DTI ≥ 6 quota system. The model now weights the 20% ADI quota as the primary friction variable for this cohort.
- Index Calibration (APN Asset-Wage Decoupling Index™ – 24610): The index is recalibrated to reflect the > 2-standard-deviation inversion in wage growth, tracking the 1.4 percentage-point swing from a private-sector-led model to a public-sector-led one. This measures the state’s direct inflationary impact.
- Data Capture (APN System Friction Index™ – 24220): This analysis triggers a new data capture mandate to integrate ASIC corporate insolvency data and ATO tax default statistics as primary inputs. The index will now track B2B default velocity in the construction and retail sectors as a leading indicator of systemic sustained friction.
Disclaimer
The analysis and information contained in this deconstruction are for general informational and strategic purposes only and do not constitute financial, investment, legal, or any other form of professional advice. The Australian Property Network (APN) is a strategic intelligence organisation and is not a licensed financial advisor.
This analysis is based on data and information from third-party sources believed to be reliable; however, APN provides no warranty as to its accuracy, currency, or completeness. Images used in this analysis are for illustrative and conceptual purposes only and may not represent real persons, properties, or events.
All frameworks (Codex 24100-24600) are proprietary to APN.
Property values and market conditions can go up or down. Before making any property or investment decisions, you must conduct your own thorough research and seek independent professional advice tailored to your specific circumstances.