

Where Investors Borrow: The Investor Share of New Home Loans, State by State
Investors took out 40.3% of new home loans in the year to June 2026, up from 27.4% six years earlier. The share runs from 48.3% in the Northern Territory to 28.2% in the ACT, and Western Australia's has more than...
Rising Together: How Often Dwelling Prices and Home Loan Numbers Move in the Same Direction
Through 2025 the mean dwelling price and the number of new home loans rose together for four quarters, the longest run since 2011. In the June quarter of 2026 both fell, for the first time since March 2023. Across 59...
Median House and Unit Prices in the Capitals and the Regions, June Quarter 2026
The median house sold for $1,487,600 in Sydney and $1,155,000 in Brisbane in the June quarter of 2026, on preliminary ABS figures. Melbourne, at $850,000, is sixth of the eight capitals: up 2.4% in five years against 87.0% in Perth...
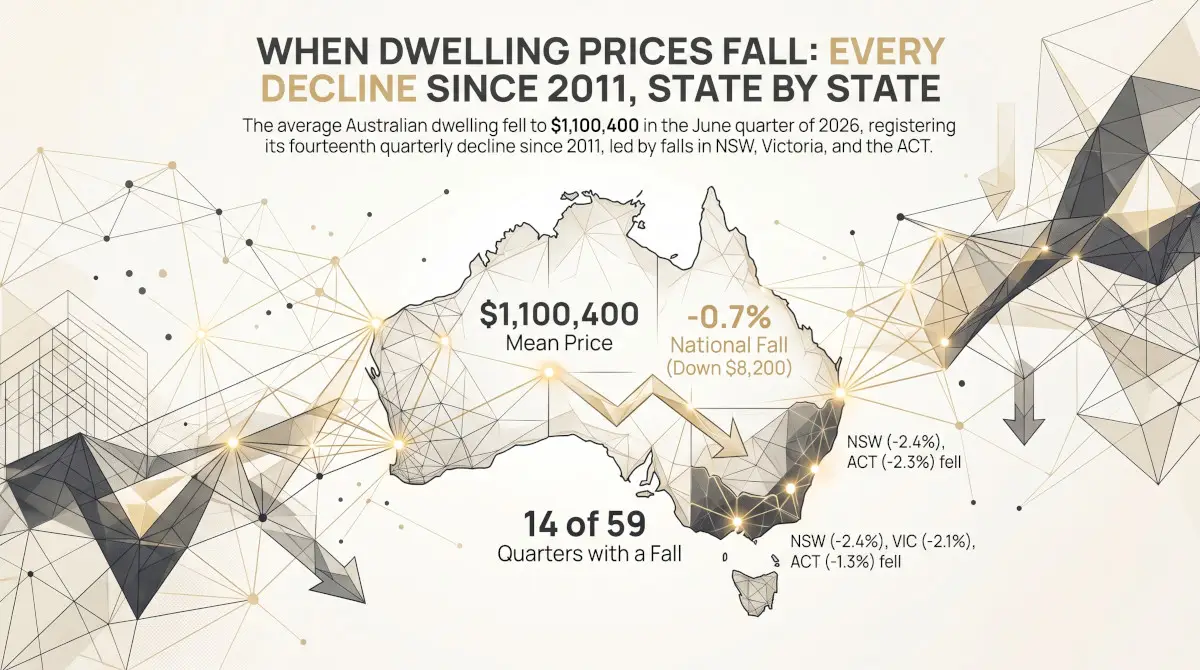
When Dwelling Prices Fall: Every Decline Since 2011, State by State
The average Australian dwelling was valued at $1,100,400 in the June quarter of 2026, $8,200 less than in March: the fourteenth quarterly fall in 59 quarters. New South Wales, Victoria and the ACT fell; the other five states and territories...
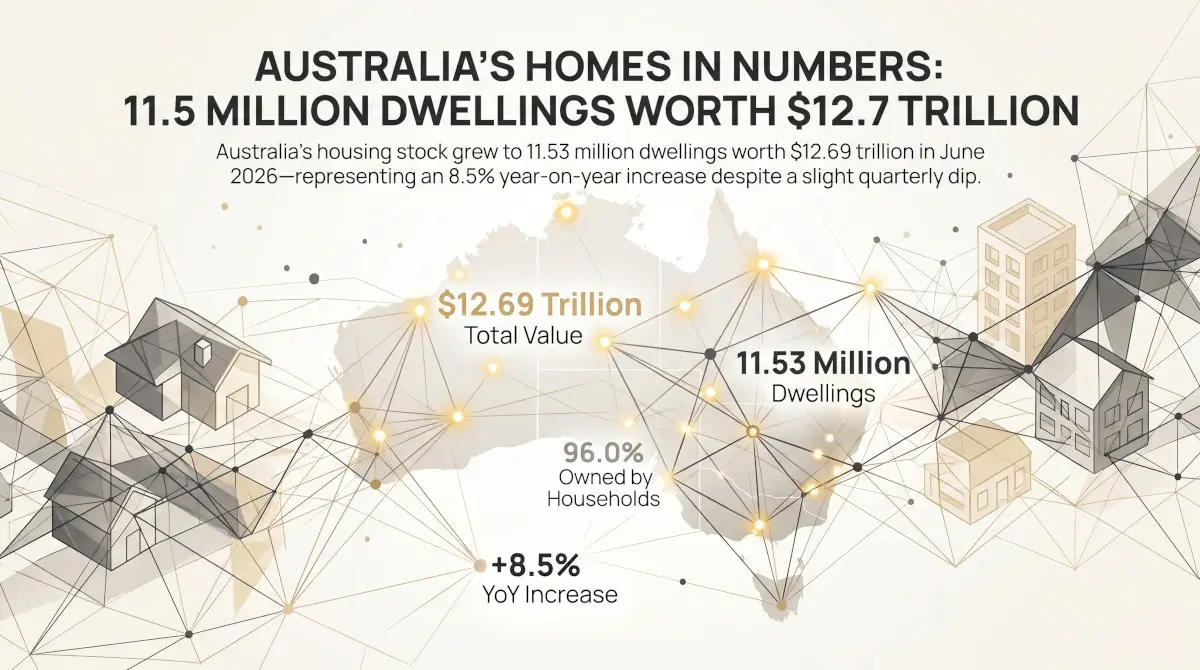
Australia’s Homes in Numbers: 11.5 Million Dwellings Worth $12.7 Trillion
Australia had 11.53 million dwellings worth $12.69 trillion at the June quarter of 2026, $992bn more than a year earlier but $34bn less than in March, the first quarterly fall in the total since 2022. Households own 96.0% of the...

What Australia Is Approving Outside Housing: Non-Residential Building by Type
Australia approved $95.7bn of non-residential building in the year to August 2026, close to double 2019. A fifth of it, $19.3bn, is in the ABS category that includes data centres, against $0.62bn seven years earlier. Offices fell from 18.3% of...
