

Public Groundwork in the June Quarter 2026: Electricity Down, Water and Sewerage at Records
Public engineering work on roads, water, sewerage and electricity grew 4.3% over the year to June 2026, below its long-run average. Electricity work fell 5.8% while water, sewerage and roads each reached the largest quarter in a series that begins...

South Australia, June Quarter 2026: A Record Dwelling Pipeline and Record Public Investment
South Australia began 15,401 dwellings in the year to June 2026 and had 15,880 under construction, both records since 1984. Public investment rose 17.8% in real terms, the most of the eight jurisdictions; June quarter completions fell, but completions over...
The Socio-Economic Ladder, State by State: Where Australians Lived in 2021
At the 2021 Census, more than half of ACT residents lived in Australia's most advantaged fifth of localities, and a third of Tasmanians in the least advantaged fifth. Each state's residents on the national socio-economic ladder.
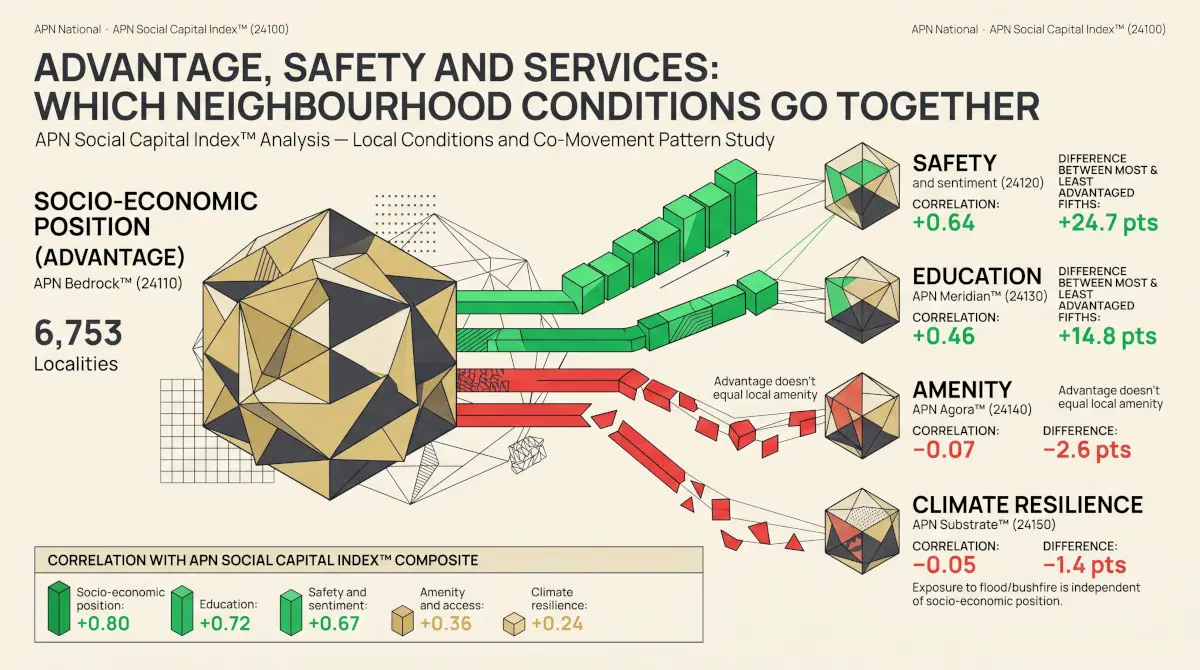
Advantage, Safety and Services: Which Neighbourhood Conditions Go Together
Across 6,782 Australian localities, socio-economic position goes with safety and education but not with local amenity or resilience to natural hazards. What the five pillars of the APN Social Capital Index show when set side by side.
Dwelling Approvals, August 2026: Houses Lead a Rising Year
Australia approved 208,184 new homes in the 12 months to August 2026, up 9.5% and the most since April 2022. House approvals led, while Queensland and Western Australia rose most among the larger states.
The August 2026 CPI: Housing Costs by Capital City
Consumer prices rose 4.0% over the year to August 2026 and housing costs 5.7%, from 4.5% in Melbourne to 7.9% in Adelaide. Electricity, new home prices and rents drove the differences between the capitals.
