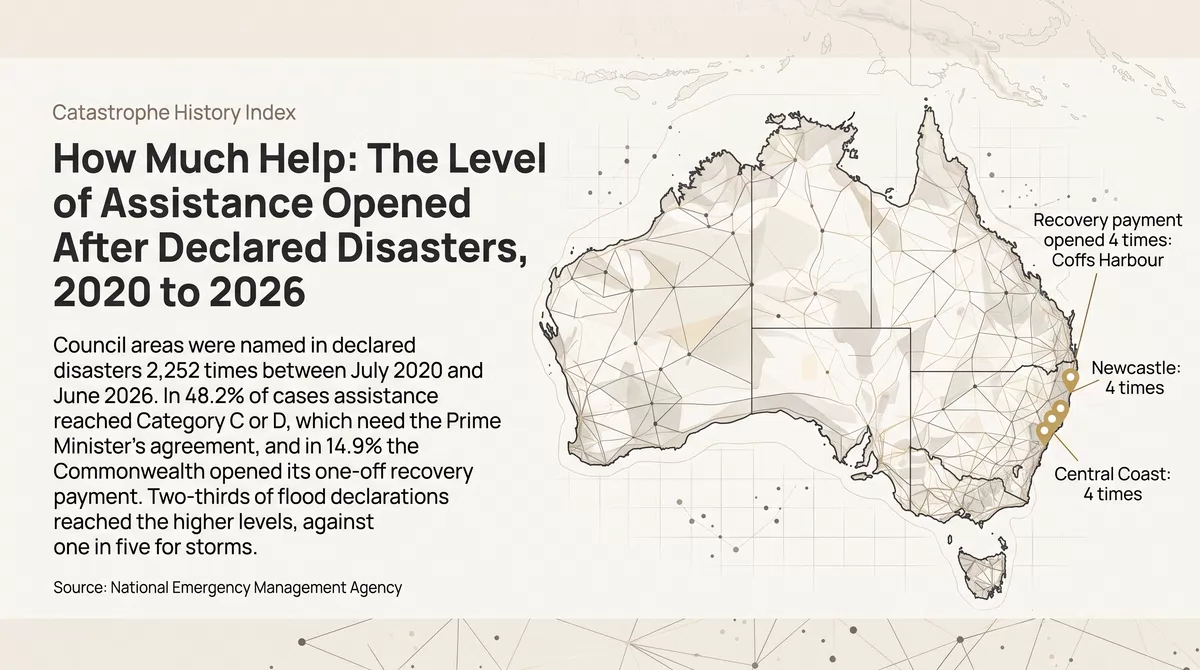

When a natural disaster is declared for joint Commonwealth and state assistance, the help that follows comes in levels. Between July 2020 and June 2026, council areas were named in declared disasters 2,252 times. In 52% of those cases assistance stayed at the two standard levels. In 48% it reached the higher levels that need the Prime Minister’s agreement, and in 15% the Commonwealth also opened its one-off payment to residents. Floods account for most of the higher-level assistance.
The level of assistance opened is a decision of governments. It is not a measure of damage, and the file records what was activated, not what was paid.
The levels of assistance
The Disaster Recovery Funding Arrangements are a cost-sharing arrangement under which the Commonwealth may reimburse a state or territory for up to 75% of the assistance it provides after a disaster. The National Emergency Management Agency describes four categories of assistance.
- Category A is help for individuals in personal hardship or distress as a direct result of the disaster. A state or territory can provide it without Commonwealth approval.
- Category B covers the restoration of essential public assets such as roads and bridges, some emergency operations, and concessional loans, subsidies or grants to small businesses, primary producers and not-for-profit organisations. It also needs no Commonwealth approval.
- Category C is for communities, regions or sectors where the impact is judged to be greater, and may include clean-up and recovery grants for small businesses and primary producers or a community recovery fund. A state or territory must request it and the Prime Minister must agree.
- Category D is assistance for exceptional circumstances beyond the other three categories. It also needs a request and the Prime Minister’s agreement, and its cost is generally shared equally.
Two Commonwealth payments to people sit beside these. The Australian Government Disaster Recovery Payment is a one-off payment of $1,000 for each eligible adult and $400 for each child, not means tested. The Disaster Recovery Allowance is short-term income support, for up to 13 weeks, for employees, small business owners and farmers who lose income as a direct result of a disaster. Both are activated disaster by disaster, and they are referred to below as the recovery payment and the recovery allowance.
The agency’s activation history records, for each council area named in each event, which of these were activated. This article counts those records for events that started between 1 July 2020 and 30 June 2026. A declaration here is one council area named in one event. Companion articles cover how often council areas are declared, and for what, and declarations for flood, bushfire and storm.
How often each level is opened
Share of council-area declarations with each kind of assistance activated, July 2020 to June 2026
APN calculation based on National Emergency Management Agency data: DRFA Activation History by LGA, events starting 1 July 2020 to 30 June 2026, file of 11 August 2026. Share of the 2,252 council-area declarations for which each kind of assistance is recorded as activated. A declaration is one council area named in one event activated under the Disaster Recovery Funding Arrangements.
Category B, which pays to restore roads and other public assets, is recorded in nearly every declaration: 2,245 of 2,252. Category A, the help for people in hardship, is recorded in 1,719, or 76.3%. So about one declaration in four opened assistance for public assets and businesses without opening hardship assistance for individuals.
Category C is recorded in 687 declarations and Category D in 993. One or both are recorded in 1,085, which is 48.2% of all declarations. The recovery allowance was activated in 658 declarations and the recovery payment in 336. The recovery payment was never activated without the allowance.
The higher levels are concentrated in few events. The 2,252 declarations come from 354 separate events. Category C or D assistance was recorded for at least one council area in 48 of them, the recovery allowance in 32 and the recovery payment in 23. Within an event the level can differ from one council area to the next.
By hazard
Share of declarations reaching Category C or D, by hazard
APN calculation based on National Emergency Management Agency data: DRFA Activation History by LGA, events starting 1 July 2020 to 30 June 2026, file of 11 August 2026. Share of declarations for which Category C or Category D assistance is recorded, by the hazard the agency assigns to the event. Five declarations for other hazards are not shown. A declaration is one council area named in one event activated under the Disaster Recovery Funding Arrangements.
67.8% of flood declarations reached Category C or D, against 43.1% for cyclones, 34.7% for bushfires and 19.0% for storms. Floods make up about half of all declarations and 72% of those that reached the higher levels. Of the 336 declarations with the recovery payment, 285 were for flood, 34 for cyclone, 13 for storm and 4 for bushfire.
The bushfire figures describe the six years counted. The file does not hold the bushfire season of 2019–20.
Year by year
Share of declarations reaching Category C or D, by year
APN calculation based on National Emergency Management Agency data: DRFA Activation History by LGA, events starting 1 July 2020 to 30 June 2026, file of 11 August 2026. Share of declarations for which Category C or Category D assistance is recorded, by the financial year in which the event started. A declaration is one council area named in one event activated under the Disaster Recovery Funding Arrangements.
The share reaching Category C or D was above 60% in 2021–22 and 2022–23, the two years that took in the floods of 2022 in New South Wales, Queensland and Victoria, and about a third in 2023–24 and 2025–26.
| Year to June | Declarations | Reached C or D | Recovery allowance | Recovery payment |
|---|---|---|---|---|
| 2020–21 | 339 | 151 | 86 | 86 |
| 2021–22 | 505 | 320 | 206 | 131 |
| 2022–23 | 334 | 207 | 182 | 68 |
| 2023–24 | 358 | 110 | 14 | 11 |
| 2024–25 | 373 | 185 | 118 | 39 |
| 2025–26 | 343 | 112 | 52 | 1 |
APN calculation based on National Emergency Management Agency data: DRFA Activation History by LGA, events starting 1 July 2020 to 30 June 2026, file of 11 August 2026. Declarations by the financial year in which the event started, with the number for which each kind of assistance is recorded.
The recovery payment follows the same years more sharply. It was activated in 285 declarations in the first three years and 51 in the last three, including 1 in 2025–26. The five events with the most council areas receiving the payment were all floods that began between March 2021 and October 2022, and they account for 225 of the 336.
State by state
Share of declarations reaching Category C or D, by state
APN calculation based on National Emergency Management Agency data: DRFA Activation History by LGA, events starting 1 July 2020 to 30 June 2026, file of 11 August 2026. Share of declarations for which Category C or Category D assistance is recorded, by state. The Australian Capital Territory, with four declarations, is not shown. A declaration is one council area named in one event activated under the Disaster Recovery Funding Arrangements.
| State | Declarations | Reached C or D | Recovery allowance | Recovery payment |
|---|---|---|---|---|
| New South Wales | 770 | 432 | 338 | 215 |
| Victoria | 436 | 226 | 83 | 42 |
| Queensland | 637 | 297 | 178 | 60 |
| South Australia | 65 | 34 | 9 | 0 |
| Western Australia | 176 | 30 | 20 | 11 |
| Tasmania | 73 | 56 | 18 | 6 |
| Northern Territory | 91 | 10 | 12 | 2 |
| Australian Capital Territory | 4 | 0 | 0 | 0 |
| Australia | 2,252 | 1,085 | 658 | 336 |
APN calculation based on National Emergency Management Agency data: DRFA Activation History by LGA, events starting 1 July 2020 to 30 June 2026, file of 11 August 2026. Declarations by state, with the number for which each kind of assistance is recorded.
About half of the declarations in New South Wales, Victoria, South Australia and Queensland reached Category C or D. In Tasmania the share is 76.7%, on 73 declarations, and in Western Australia and the Northern Territory it is 17.0% and 11.0%. New South Wales has 215 of the 336 declarations with the recovery payment.
These differences are not a measure of how much damage each state suffered. States decide which categories to seek, how to divide a season into events and which council areas to name, and the practice differs between them.
Where the recovery payment has been opened
Council areas by number of events with the recovery payment activated, July 2020 to June 2026
APN calculation based on National Emergency Management Agency data: DRFA Activation History by LGA, events starting 1 July 2020 to 30 June 2026, file of 11 August 2026. The 546 council areas with a population estimate, by the number of declared events in which the Australian Government Disaster Recovery Payment is recorded as activated for the council area, with the share of their residents beside each bar. Residents are the ABS estimated resident population at 30 June 2025 (Regional Population, 2024–25).
The recovery payment was activated at least once for 199 of the 546 council areas, which together hold 58.1% of residents. That is the share of people living in a council area where the payment was opened, not the share who were eligible: a resident must have been affected by the disaster, and the conditions are set for each event.
No council area had the payment activated more than four times. Twelve had it four times, all in New South Wales, on the Mid North Coast, in the Hunter and on the Central Coast. Category C or D assistance was recorded at least once for 368 council areas, holding 80.9% of residents.
What this does not show
The file records which kinds of assistance were activated for a council area. It does not say how much was paid, how many people or businesses received it, or how long it took. A category can be activated for a council area and reach a small part of it. The level opened reflects decisions by state governments and the Commonwealth as well as the damage done, so it cannot be read as a ranking of disasters or of places. The six years counted include a run of very large floods in the east and do not include the bushfires of 2019–20.
- Australian Bureau of Statistics (Reference period: 2024–25) Regional Population [https://www.abs.gov.au/statistics/people/population/regional-population/latest-release], ABS Website, accessed 13 October 2026.
- Australian Government, Disaster Assist Disaster Recovery Allowance [https://www.disasterassist.gov.au/disaster-arrangements/disaster-recovery-allowance], accessed 13 October 2026.
- Australian Government, Disaster Assist Disaster Recovery Payment [https://www.disasterassist.gov.au/disaster-arrangements/disaster-recovery-payment], accessed 13 October 2026.
- National Emergency Management Agency (Reference period: events to June 2026) DRFA Activation History by LGA (file of 11 August 2026) [https://data.gov.au/data/dataset/drfa-activation-history-by-lga], accessed 13 October 2026.
- National Emergency Management Agency Disaster Recovery Funding Arrangements [https://www.nema.gov.au/our-work/disaster-recovery/disaster-recovery-funding-arrangements], accessed 13 October 2026.
National Emergency Management Agency material is used under a Creative Commons Attribution 2.5 Australia licence. ABS material is used under a Creative Commons Attribution 4.0 International licence. Calculations, standardisations and index readings are APN’s and are not attributable to the ABS.
Disclaimer
The analysis and information contained in this publication are for general informational and strategic purposes only and do not constitute financial, investment, legal, or any other form of professional advice. Australian Property Network is not a licensed financial advisor. Property values and market conditions can go up or down. Before making any property or investment decisions, you must conduct your own thorough research and seek independent professional advice tailored to your specific circumstances. Images are for illustrative purposes only. E.&O.E.
Findings are presented on the basis of data and evidence alone.