Monetary Policy Structural Adjustment: Why a 4.10% Cash Rate Presents a Material Risk to the Australian Mortgage Market
APN ANALYSIS: A-260118-AUS134820
Executive Summary
A fundamental structural adjustment has emerged in Australian monetary policy consensus. As of January 2026, the established orthodoxy of a 3.60% terminal cash rate, championed by Westpac and ANZ, is now directly challenged by a “Hawk” narrative from NAB and CBA, which projects a resumption of the tightening cycle to 4.10% by May 2026. This 50-basis-point divergence is not speculative; it is a direct response to persistent domestic services inflation, evidenced by the October 2025 CPI print of 3.8%, which confirmed that Australia’s inflation has decoupled from global trends.
For property professionals, this “Hawk Split” fundamentally alters the risk landscape. The shift from a “peak rate” psychology to a “second wave” tightening scenario demands an immediate recalibration of risk models and client advice. The primary commercial risk is the collision of a 4.10% cash rate with APRA’s 3% serviceability buffer, which would push mortgage assessment rates to a materially restrictive 9.85%. This regulatory threshold creates the potential for a widespread refinancing constraint for leveraged borrowers, directly impacting deal flow, valuation stability, and credit availability across the market.
Background & Strategic Context
This bifurcation in monetary policy consensus is a textbook validation of APN’s core macro-theses. It demonstrates how state-level actors (the RBA and APRA) set the boundaries of the market (APN Sovereign Policy Composite Index™ (SPCI, 24800)), and how their interventions create divergent outcomes that amplify the financial pressure on leveraged households while insulating capital-rich incumbents. The market is now pricing the operational risk of a renewed regulatory tightening cycle, a core focus of the APN Risk & Compliance Index™ (24200).
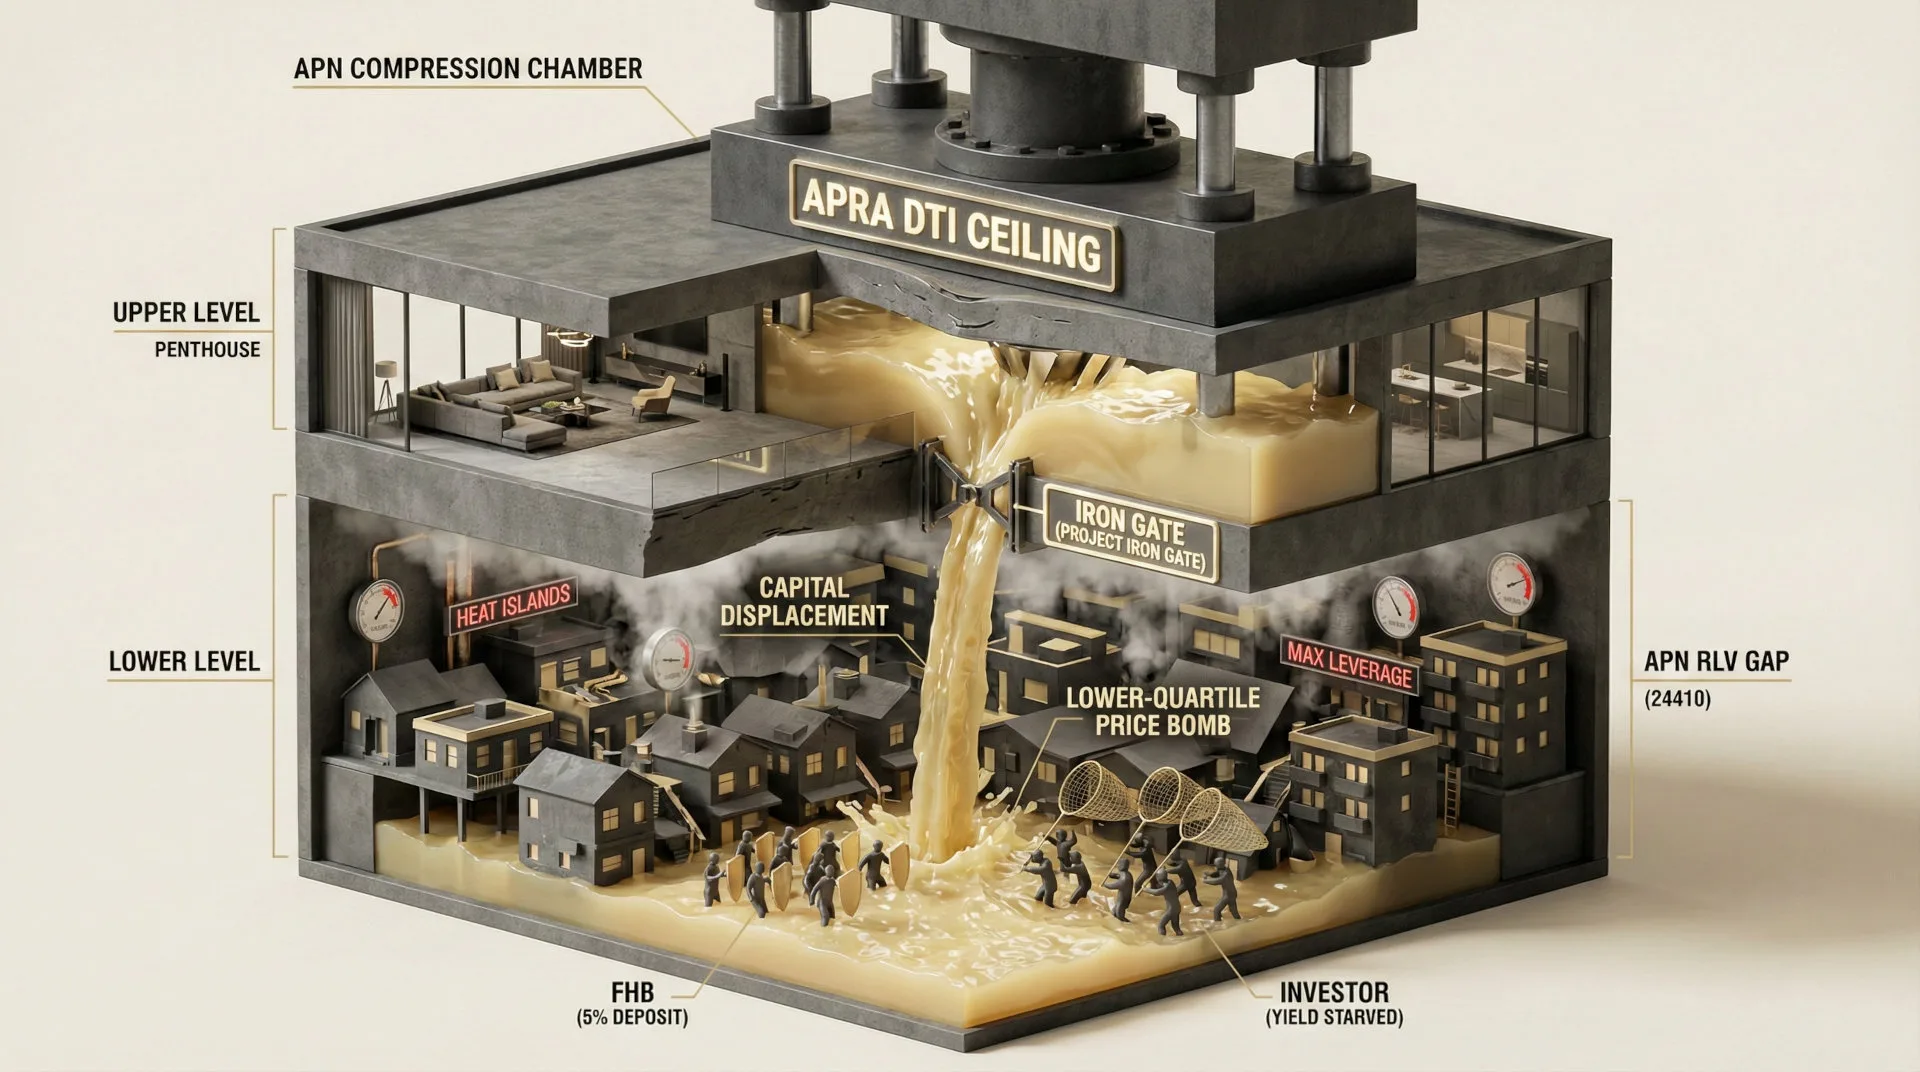
Convergent Regulatory Pressures (APN Risk & Compliance Index™ (24200)): The analysis highlights the collision of two significant regulatory forces: the RBA’s potential rate hikes and APRA’s static 3% serviceability buffer, compounded by new Debt-to-Income (DTI) caps effective 1 February 2026. This combination creates a regulatory constraint on refinancing liquidity for the most exposed borrowers, an elevated risk factor monitored by our compliance framework.
The Inflation Decoupling (APN Sovereign Policy Composite Index™ (SPCI, 24800)): The persistence of “sticky services” inflation, amplified by domestic wage-setting mechanisms, demonstrates how national policy choices can cause the Australian economy to decouple from global disinflationary trends. This forces the RBA into a divergent policy path from its international peers, a key tenet of our analysis on state-level market drivers.
The K-Shaped Divergence: The simultaneous rise in non-performing loans (breaching 1.0%) and record-high offset account balances (exceeding $300 billion) provides clear evidence of a K-shaped economic reality. The “Hawk” scenario will apply disproportionate structural constraints to the lower arm of this K, households without capital buffers, by deploying the serviceability buffer as a constraint against them, thereby accelerating structural capital asymmetry.
Deconstruction of the Source Event
This deconstruction is based on APN’s analysis of recent market data, regulatory filings, and institutional economic forecasts. The key facts are:
- The Consensus Divergence: As of January 2026, institutional forecasts have materially diverged. Westpac and ANZ maintain a “Hold” forecast at a 3.60% cash rate, while NAB and CBA have pivoted to a “Hawk” forecast, projecting a terminal rate of 4.10% by May 2026.
- The Inflation Catalyst: The hawkish pivot was prompted by the October 2025 Headline CPI print of 3.8% year-on-year. This result significantly breached market consensus (3.6%) and confirmed that the “last mile” of disinflation had stalled well above the RBA’s 2–3% target band.
- The Market Repricing: The ASX 30-Day Interbank Cash Rate Futures market executed a material “Reversal” around 16 December 2025. Pricing flipped from anticipating rate cuts in 2026 to pricing in a material probability of hikes, with the implied yield for December 2026 reaching 3.94%, directionally endorsing the NAB forecast.
- The Regulatory Threshold: A 4.10% cash rate, if fully passed through by lenders, would push the typical variable mortgage rate to approximately 6.85%. Combined with APRA’s mandatory 3.00% serviceability buffer, this results in a refinancing assessment rate of 9.85%, creating a material refinancing constraint for many borrowers who qualified on much lower assessment rates.
Critical Analysis & Balanced View
The “Hawk Split” represents a fundamental structural contest between realised data and economic theory. The hawkish view, adopted by NAB and CBA, is a rational, evidence-based response to the empirical failure of the 2025 disinflation narrative. The 3.8% CPI print is an empirical data point that a risk-averse RBA cannot ignore, particularly given its hawkish statements in December which prioritised realised inflation over forward-looking models. The persistence of sticky services inflation, a phenomenon also observed in the US and Japan, further validates the central bank’s risk perception.
Conversely, the “Hold” thesis, maintained by Westpac, offers a plausible counter-narrative for a managed economic deceleration. It rests on the hypothesis that productivity growth is recovering faster than RBA models assume, which would allow the economy to absorb higher wage costs without generating inflation, thus negating the need for further rate hikes. This view posits that the RBA should look through the current inflation spike and rely on these structural improvements.
However, the risk asymmetry is materially tilted towards the hawkish scenario. For the RBA, the reputational damage of letting inflation remain structurally embedded far outweighs the risk of overtightening. In an environment where credibility is paramount, realised adverse data (high CPI) will almost certainly take precedence over prospective positive data (forecast productivity). Therefore, while the “Hold” view represents an optimistic upside case, the 4.10% “Hawk” scenario must be treated as the primary risk-weighted scenario for all strategic planning.
Strategic Implications for Property Professionals
- For Developers: Immediately stress-test project feasibility and funding covenants against a 4.10% cash rate scenario. The new DTI caps effective 1 February 2026, will constrict investor demand at the higher-leverage end of the market, potentially reducing pre-sale velocity and increasing settlement risk.
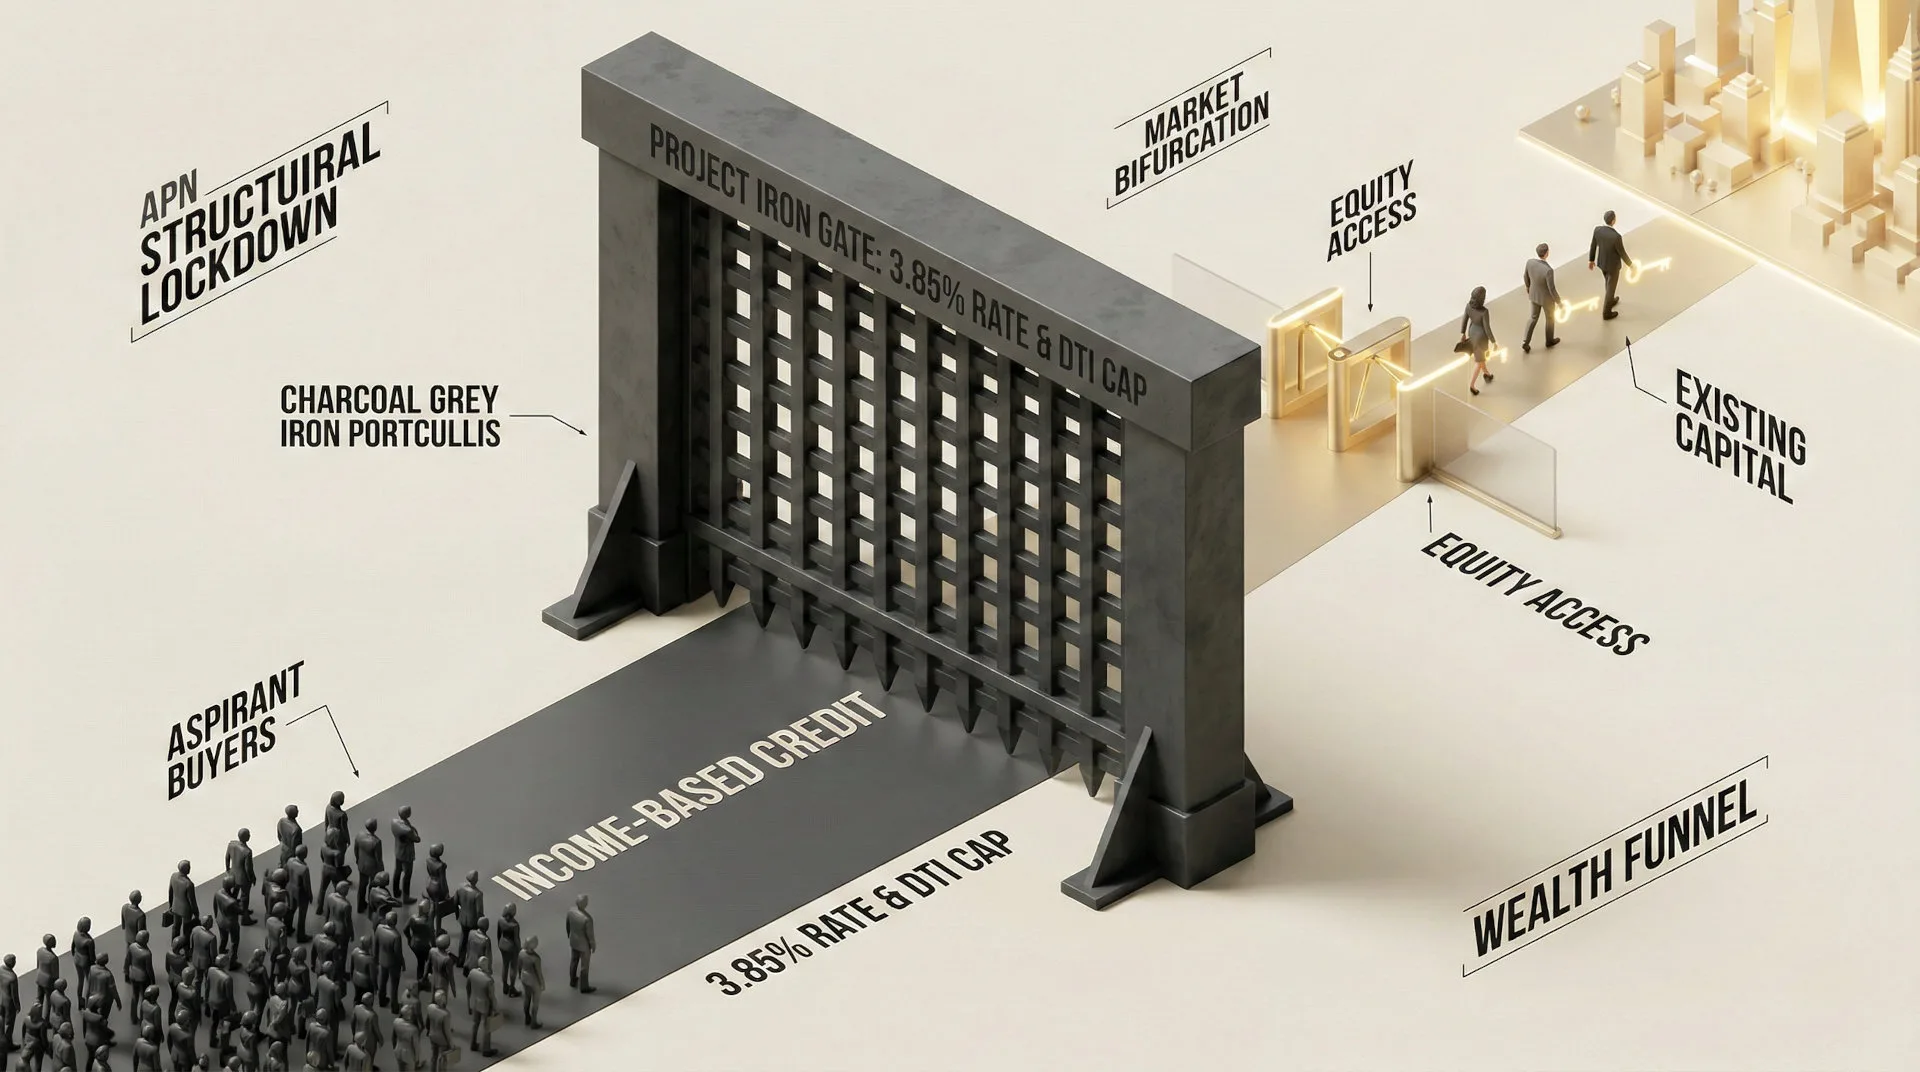
- For Agents & Buyers’ Agents: Prepare for a materially bifurcated market. Cash-rich buyers and those with significant equity will be insulated, but borrowing capacity for first-home buyers and leveraged upgraders will shrink significantly. The refinancing constraint phenomenon will reduce listing volumes from discretionary sellers, constraining transactional activity.
- For Mortgage Brokers & Lenders: The 9.85% serviceability assessment rate is the new elevated threshold. A strategic opportunity exists to proactively identify clients on expiring fixed rates who are at risk of being constrained from refinancing, and to advise on balance sheet optimisation and debt consolidation before they become constrained by serviceability requirements.
- For Valuers & Risk Managers: The probability of distressed sales has materially increased. The 1.04% non-performing loan rate is a lagging indicator; forward-looking risk models must now price in the impact of the serviceability buffer breach, which will act as a material constraint on refinancing and could suppress values in postcodes with high concentrations of recently-originated, high-LVR loans.
APN Index Management
The APN Codex 24000 Series is a proprietary set of indices that translates complex market forces into measurable metrics. This section outlines how the preceding analysis is validated against, and informs the calibration of, these frameworks.
- Validation: This analysis validates the sensitivity of the APN Risk & Compliance Index™ (24200) to the interplay between monetary policy and macroprudential settings. The “serviceability buffer breach” is a textbook example of a systemic risk factor tracked by the APN Risk & Compliance Index™ (24200).
- Index Calibration: The APN Regulatory Velocity Multiplier™ (APN RVM™) (24210) is calibrated to reflect the market’s repricing of RBA hawkishness and the high-impact implementation of the February 1 DTI cap, signifying a material tightening of regulatory friction.
- Data Capture: This analysis triggers a new data capture mandate for the APN Symbiotic Intelligence Network™ (24310). We will now actively monitor broker and lender channel intelligence on the failure rate of refinancing applications against the new ~9.85% serviceability hurdle, using this as a leading indicator for future non-performing loan formation.
Disclaimer
The analysis and information contained in this deconstruction are for general informational and strategic purposes only and do not constitute financial, investment, legal, or any other form of professional advice. The Australian Property Network (APN) is a strategic intelligence organisation and is not a licensed financial advisor.
This analysis is based on data and information from third-party sources believed to be reliable; however, APN provides no warranty as to its accuracy, currency, or completeness. Images used in this analysis are for illustrative and conceptual purposes only and may not represent real persons, properties, or events.
All frameworks (Codex 24100-24500) are proprietary to APN.
Property values and market conditions can go up or down. Before making any property or investment decisions, you must conduct your own thorough research and seek independent professional advice tailored to your specific circumstances.