The Gateway Is Quiet. The Pipeline Keeps Swelling.
ABS Building Activity · March Quarter 2026 · Released 8 July 2026
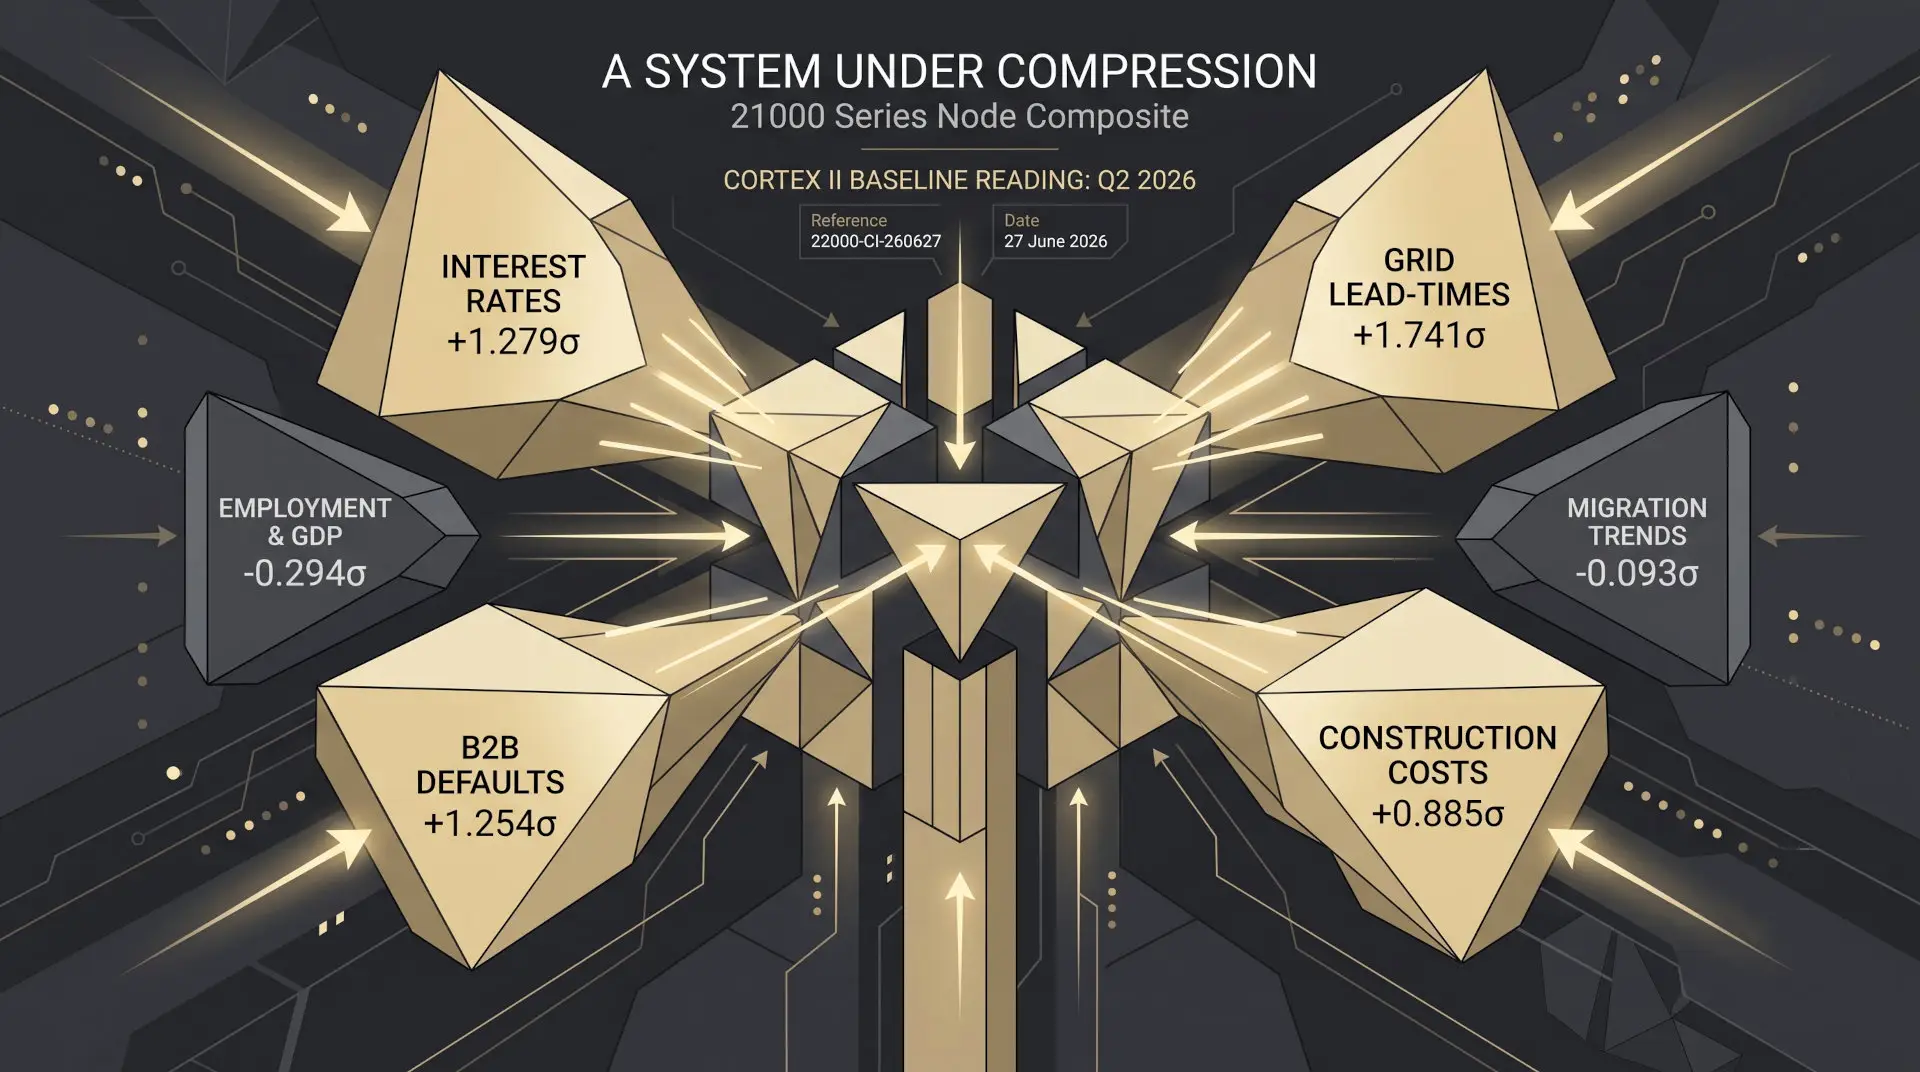
Australia’s residential construction pipeline reached a new record in the March quarter of 2026 — not because demand is surging, but because the system cannot clear work fast enough. The latest ABS Building Activity data, ingested across Building Approvals & Commencements (21510) and New Housing Supply Forecasts (21520) in APN Codex and cross-validated against Grid Connection Lead-Times (21290), tells a single coherent story: the gateway into the pipeline is effectively dormant while the backlog downstream continues to compound.
This is a delivery-friction narrative, not a demand one. Understanding the distinction matters for how the data is read and what it implies.
Work Yet to Be Done Hits a Historic High
The value of committed residential construction work yet to be delivered rose 8.25% in a single quarter and 26.3% year-on-year. It surpassed the prior record — set just last quarter at $144,788.5m — making this the second consecutive record-breaking quarter, with the growth rate accelerating rather than easing (6.65% quarter-on-quarter in December 2025; 8.25% in March 2026).
That acceleration matters. A maturing backlog that continues to grow at an increasing rate is not working itself off — it is embedding.
Volume and Value Are Diverging
The divergence between the dollar value of work in the pipeline and the physical count of dwellings under construction is one of the more telling signals in this release.
Value growing at more than twice the rate of volume implies the average cost per dwelling sitting in the pipeline is rising materially. This is a construction-cost signal embedded directly in the backlog data — independent of what CPI or PPI series are reporting in the same period. It emerges from the physical reality of what it takes to complete a committed dwelling, not from a survey or index.
Five Consecutive Quarters of Composite Increase
The New Housing Supply Forecasts (21520) composite score has now climbed without interruption for five quarters:
This is not quarterly noise. A monotonic five-quarter climb in a composite score is a structural pattern. It warrants treatment as such.
The Gateway Remains Asleep
While the pipeline swells downstream, the front end of the system shows no corresponding movement. Building Approvals & Commencements (21510) has registered a composite z-score of +0.001σ this quarter: essentially zero relative to its own 15-year history.
More telling is the eight-quarter record. Across the last two full years, Building Approvals & Commencements (21510) has ranged from −0.57σ to +0.27σ with no directional trend. The gateway has been range-bound while the pipeline has climbed almost without interruption across the same window. These two nodes should not be decoupled to this degree in a well-functioning delivery system.
The commencements number in the March quarter reinforces this: 45,342 dwellings commenced, down 16.9% from 54,542 in December 2025, unwinding nearly all of last quarter’s spike. The approvals-commencements spread flipped from −3,234 (commencements running ahead) to +2,385 (approvals now ahead) — a 5,619-unit swing in a single quarter. This pattern is consistent with commencement volatility rather than any genuine pipeline resurgence at the front end.
Independent Confirmation From Grid Connection Lead-Times (21290)
The Holding Cost Decay metric within Grid Connection Lead-Times (21290) is built from the same Completions and DUC inputs as New Housing Supply Forecasts (21520) but via an entirely separate formula. In the March quarter, it reported pipeline clearance time jumping from 5.86 months to 7.50 months in a single quarter: a 28% increase, reversing four consecutive quarters of easing.
Two independent methodologies, sourced from separate nodes, drawing on overlapping but non-identical inputs, reach the same conclusion: the pipeline is backing up, not clearing. The prior four quarters of gradual easing have reversed in a single quarter.
What the Data Shows
The March quarter 2026 building activity release presents a pipeline at historic scale, growing in value faster than in volume, unclearable at current throughput rates, and not being meaningfully replenished or relieved at either end. The front-end gateway indicators have been range-bound for two years. The back-end clearance metric has just reversed sharply.
The framing that fits the evidence: this is a structural delivery-friction condition, now in its fifth consecutive quarter of compound accumulation, with independent corroboration across multiple nodes. Whether that friction is labour, materials, finance, connection infrastructure, or some combination is a question the Codex sub-node architecture is designed to isolate — and the answer varies by geography and project type.
The record WYTBD figure is not a signal of demand strength. It is a measure of how much committed work the system has not yet been able to complete.