A System Under Compression — 21000 Series Node Composite: Q2 2026
Analytical Preface
This reading presents the current state of the APN Codex 21000 Series node composite — the sovereign data layer of the Codex architecture — as at Q2 2026. It does not present new primary data. It synthesises the z-score outputs of nine active nodes into a forward-facing assessment of the structural operating environment. The Cortex II inference boundary applies throughout: analytical claims extend only as far as the current node readings support. No declarative forward statements are made.
Node observations carry differing currency. Three nodes (21210, 21220, 21230) are current to Q2 2026. Three nodes (21240, 21260, 21270) carry Q1 2026 readings. Two nodes (21250, 21290) carry Q4 2025 readings. Node 21280 carries a Q2 2025 reading and is treated as directional context only.
The current configuration of the APN Codex 21000 Series node composite does not present as a system in distress. It presents as a system under compression — one in which the cost of capital and the cost of production are simultaneously elevated above their historical baselines, while the demand-side inputs that sustained the preceding expansion are in measured retreat. This is a structurally distinct condition from either a growth environment or a contraction, and it warrants a reading on its own terms.
The most current nodes — Interest Rates (21210), Inflation (21220), and Employment & GDP (21230) — all carry Q2 2026 observations. They are the freshest signals in the composite and they are internally coherent: rates remain elevated, inflation persists mildly above baseline, and the labour market is beginning to soften. The remaining nodes carry Q1 2026 or earlier observations and must be read as directional context rather than live readings.
The Rate Environment
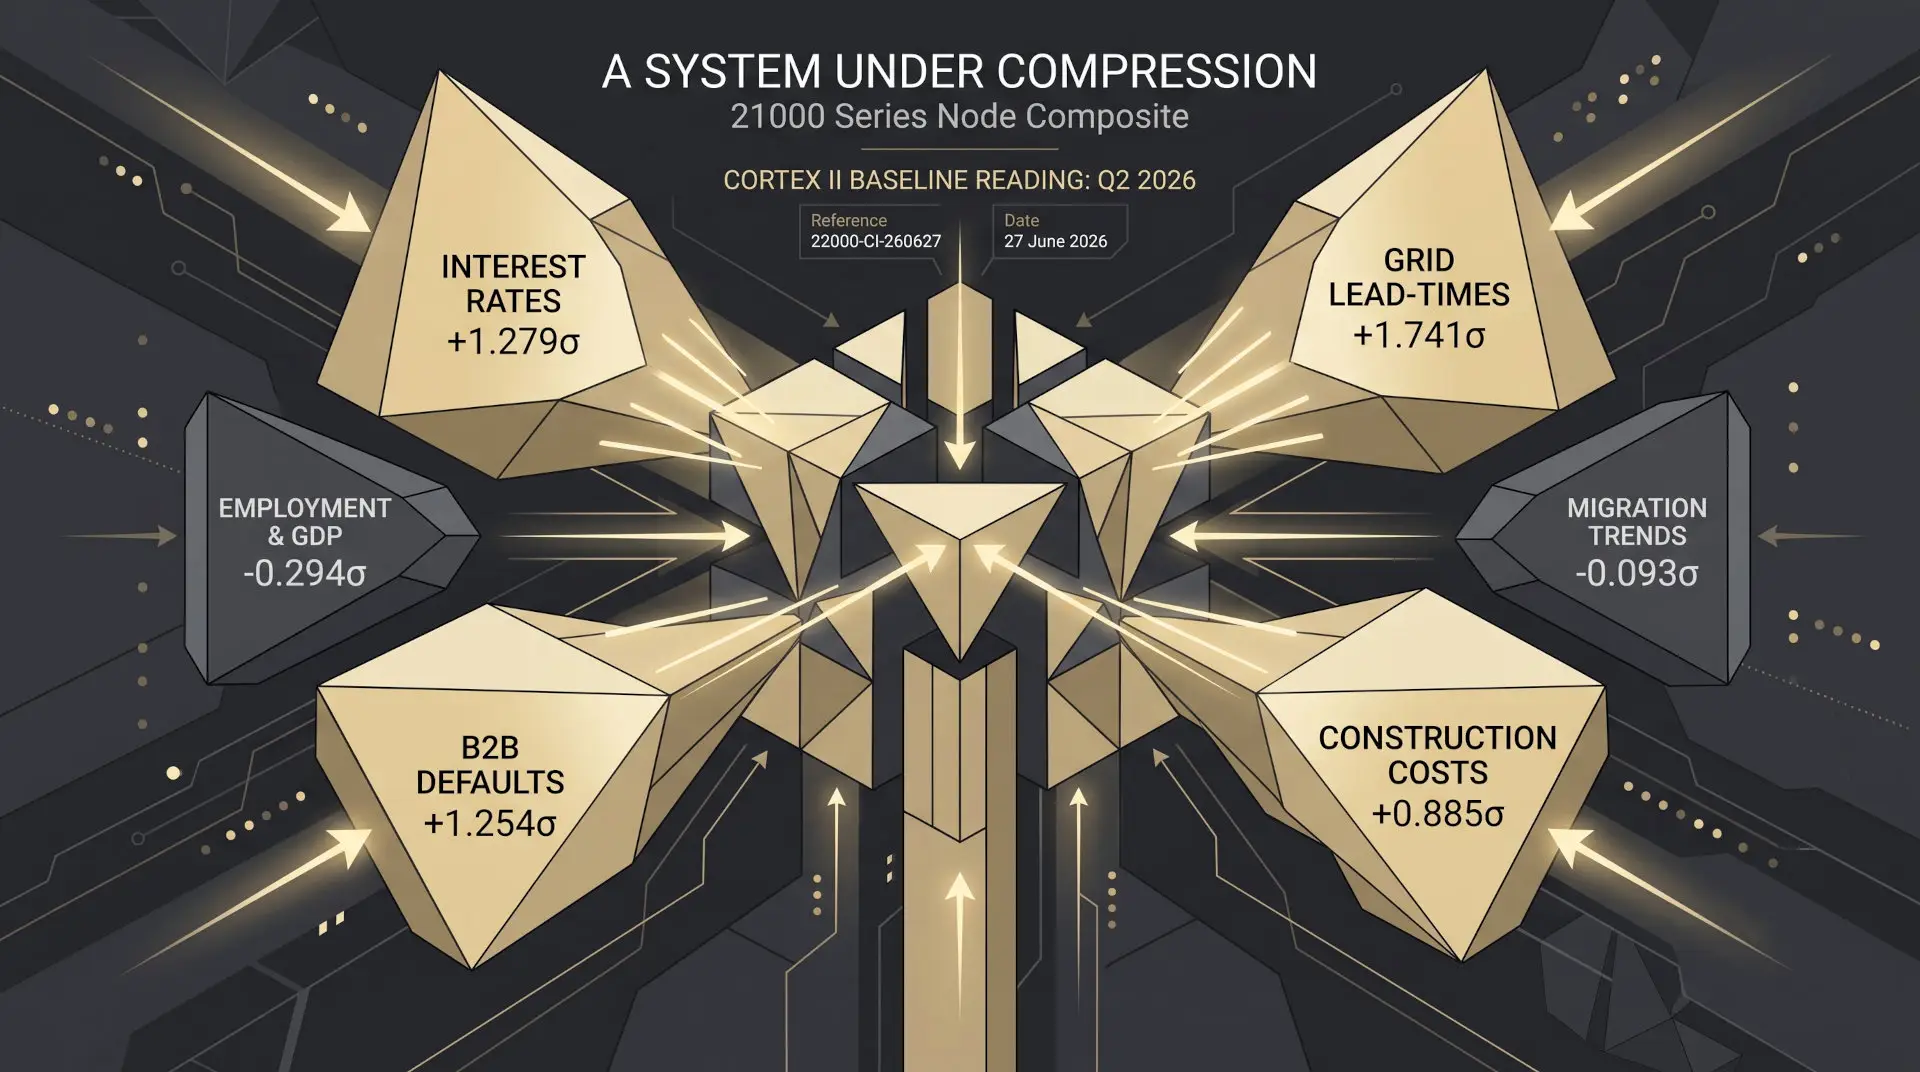
Interest Rates (21210) records a z-score of +1.279σ at Q2 2026 — the most elevated fresh node in the active set. Three series are present: the RBA Cash Rate Target (Series 24), the two-year Australian Government bond yield via FCMYGBAG2D (Series 26), and the standard variable housing loan rate (Series 25).
The June quarter carried the third consecutive rate increase of the current tightening cycle. The RBA Board lifted the cash rate by 25 basis points to 4.35% on 5 May 2026 — the third hike of 2026 following moves in February and March, which together reversed nearly all of the easing delivered across 2025. The June Board meeting (effective 17 June 2026) held at 4.35%, with the accompanying statement indicating the Board considered current settings sufficient to pause and monitor economic developments. The next scheduled decision is 11 August 2026.
The two-year bond yield moved from 4.595% for the week ending 7 June to 4.467% for the week ending 14 June, a modest decline at the short end consistent with the pause signal. The z-score at +1.279σ reflects the cumulative level effect of three hikes, not ongoing tightening momentum. The rate signal is elevated-and-paused — a configuration in which the full transmission of prior increases continues to work through debt-serviced asset classes while the Board assesses whether the May move was sufficient.
Construction Costs and the Supply-Side Constraint
Construction Costs & Supply Chain (21260) records +0.885σ at Q1 2026, with two series present. This positions the cost of production for new housing well above its historical norm. Taken alongside the rate environment, it establishes the dual constraint that characterises the current feasibility landscape for residential development: the cost of finance and the cost of build are both elevated simultaneously.
This configuration compresses development feasibility from both ends. It does not, in itself, signal an immediate supply response — elevated construction costs can persist through supply-chain inertia and labour market tightness independently of demand conditions. What it does indicate is that the pathway from planning approval to project commencement remains constrained by economics rather than regulatory pipeline alone.
The Employment Turn
Employment & GDP (21230) has moved to −0.294σ at Q2 2026, the only active node in negative territory at a current observation date. The series present is ABS 6202.0, the national unemployment rate (Series 32), which recorded 4.3559% for May 2026.
A single negative reading does not constitute a trend. What it does establish is that the labour market, relative to its 2011–2025 baseline, has softened measurably. The direction of the signal, at a moment when the rate environment remains at +1.279σ, is consistent with the textbook transmission mechanism: sustained above-baseline rates reducing labour demand with a lag. The magnitude of the employment softening is modest at this reading; the significance lies in the direction and timing relative to the rate signal.
The rate and employment nodes are now pulling in opposite directions within the same quarter. This is the central interplay in the current composite.
The Household Layer
Household Finance & Consumer Sentiment (21240) records +0.273σ at Q1 2026, one quarter behind the current rate and employment readings. Two series are present and the reading is mildly positive — household balance sheets, as captured to Q1 2026, had not deteriorated materially. This is a lag indicator by nature and should be read accordingly.
The Q1 reading predates the Q2 employment softening. Whether household finance conditions have followed the employment signal into negative territory will not be observable in the node composite until Q2 2026 data becomes available — most likely in the next quarterly load cycle.
Demand-Side Moderation
Migration Trends (21250) records −0.093σ at Q4 2025, essentially flat relative to the baseline. The series present is net overseas migration via ABS 3101.0 (Series 38), which recorded 56,600 arrivals for the December quarter 2025. Migration was a substantial positive demand driver for Australian property markets through 2022–24. The current reading suggests that contribution is moderating toward its long-run norm — not a negative demand signal in absolute terms, but the removal of an above-baseline demand supplement.
Inflation (21220) records +0.300σ at Q2 2026, mildly positive with a below_min_obs flag on the single series present. The reading is consistent with an inflation environment that has retreated from its 2022–23 peak but has not fully resolved to baseline. The below_min_obs flag warrants caution in weighting this node in composite synthesis.
Credit and Business Stress
Real-Time Credit Velocity (21270) records +0.554σ at Q1 2026, with a below_min_obs flag. Consumer and housing credit flows, on the available evidence, remained above their historical norm through Q1 2026. This is a counterintuitive positive against the rate environment — elevated rates have not yet produced a material contraction in credit volumes at this reading.
B2B Invoice Default Velocity (21280) records +1.254σ, but the observation date is Q2 2025 — a full four quarters behind the current rate and employment signals. The reading indicates business-to-business payment stress above historical norms as at that date. Given the elapsed time and the intervening movements in the rate and employment nodes, this figure cannot be treated as a current signal. It is noted as directional context pending a refreshed observation.
Infrastructure Constraint
Grid Connection Lead-Times (21290) records +1.741σ — the highest z-score in the active set — at Q4 2025, two quarters behind current. Infrastructure connection constraints for new development remain elevated relative to their historical norm. This is a structural constraint on the development pipeline that operates independently of financial conditions and is unlikely to resolve within a short-run horizon.
Composite Configuration
The 21000 Series node composite as at Q2 2026 presents the following configuration: sustained cost-of-capital elevation; persistent above-baseline construction costs; an employment signal that has crossed into negative territory for the first time in this cycle; household finance conditions that remain mildly positive to Q1 2026 but carry a one-quarter lag; demand-side supports moderating toward their long-run norm; and infrastructure constraints that remain structurally elevated.
This is a compression environment. The system is not signalling expansion — the two most current positive nodes, Interest Rates (21210) and Construction Costs & Supply Chain (21260), are cost nodes, not demand nodes. The one current negative node, Employment & GDP (21230), is a demand node. The conditions that drove the preceding cycle are not present in the current data, and the structural supports for further price appreciation — labour market strength, above-trend migration, household balance sheet expansion — are in measured retreat.
No node in the current composite has moved to a level that, in isolation, would constitute a distress signal. The analytical weight of this baseline reading is in the configuration as a whole: the simultaneous elevation of cost nodes and the directional softening of demand nodes is a pattern consistent with a market environment in which conditions for sustained price growth are not present, and in which feasibility constraints on new supply are structurally embedded.
The Cortex II inference boundary at this baseline: the composite is consistent with a market environment in which conditions for sustained price growth are not present, and in which feasibility constraints on new supply are structurally embedded. Forward inference beyond this point requires certified node metrics and a formal AUS-Series research protocol.
Findings are presented on the basis of data and evidence alone.