
Research Preface
Australian Property Network (APN) is an independent property intelligence platform. It carries no commercial affiliations, accepts no advertising revenue, and has no relationships with real estate industry bodies, developers, or financial institutions. Its sole purpose is to provide honest, evidence-based analysis of the Australian property market, a domain where commercially conflicted voices predominate and genuinely independent research is scarce.
The analytical foundation of APN is the APN Codex, a structured, scalable framework for organising and processing property and macroeconomic intelligence. The Codex operates as a chart of accounts for property risk data, assigning discrete numbered nodes to every relevant domain of knowledge. This architecture ensures that analysis is consistently structured, longitudinally comparable, and transparently sourced.
Within the Codex, two distinct series of nodes are relevant to this report. The 21000 Series comprises objective data inputs drawn exclusively from authoritative official sources, the Australian Bureau of Statistics and the Reserve Bank of Australia. These nodes represent what the framework receives from external institutions. The 24000 Series comprises APN’s proprietary indices, analytical constructs derived from official data through APN’s own research methodology. These represent what the framework calculates and publishes under its own intellectual architecture.
This report is published under APN Codex Node 21400 Demographic Analysis, the APN Aggregate Demographic Index™. Node 21400 is a composite of four certified subordinate nodes, Population Growth & Distribution (21410), Ageing Population & Housing Needs (21420), Household Formation Trends (21430), and Demographic Trend Analysis (21440), each capturing a discrete demographic mechanism relevant to the structural demand physics of the Australian residential asset base, valued in excess of $12 trillion. This document serves a dual purpose: it formally presents the certified 15-year baseline composite of the 21400 node series under the ratified 30/30/25/15 weighting structure adopted by APN governance in March 2026, and applies that composite to a structural synthesis of the compound demographic conditions operating on the Australian residential asset base at the Q3 2025 terminal point.
All analysis is conducted under the editorial standards of APN. Findings are presented on the basis of data and evidence alone.
Why Four Nodes Are Required
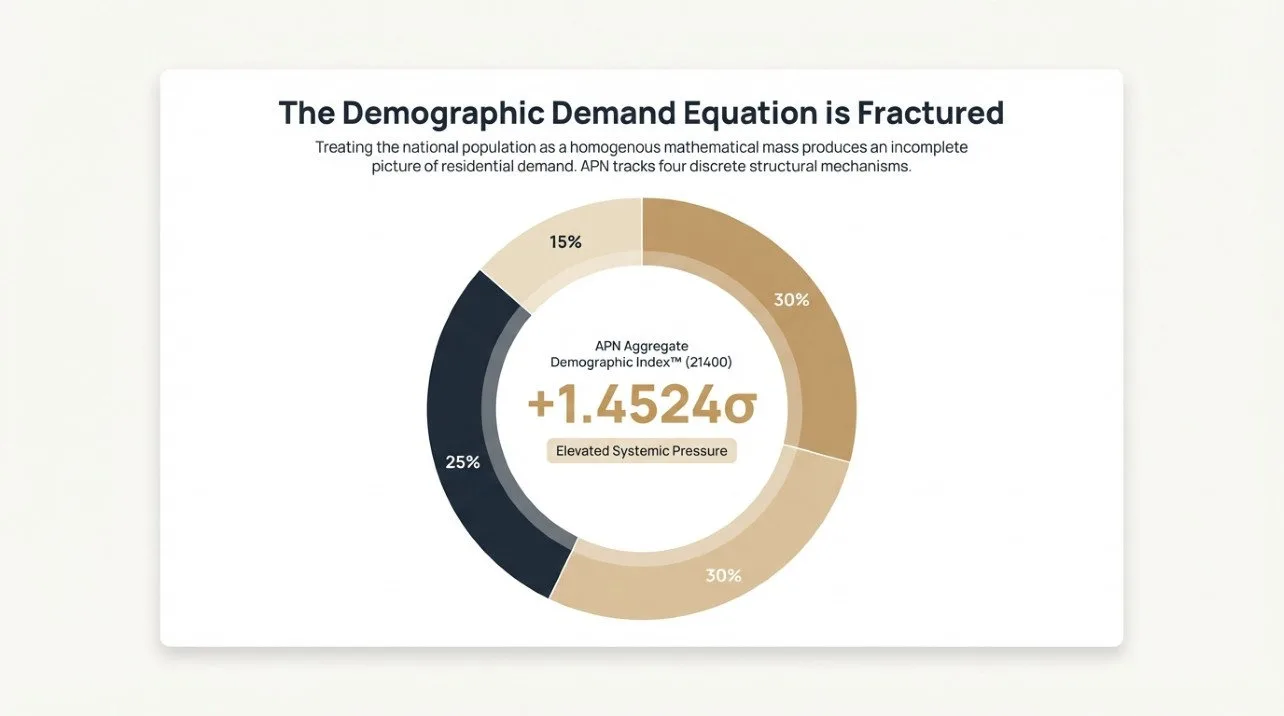
Standard property market analysis treats population growth as the primary driver of housing demand. It is not, or at least, not on its own. The APN Codex 21400 Demographic Analysis series was built on a single architectural premise: that treating the national population as a homogenous mathematical mass produces a fundamentally incomplete picture of how residential demand actually works.
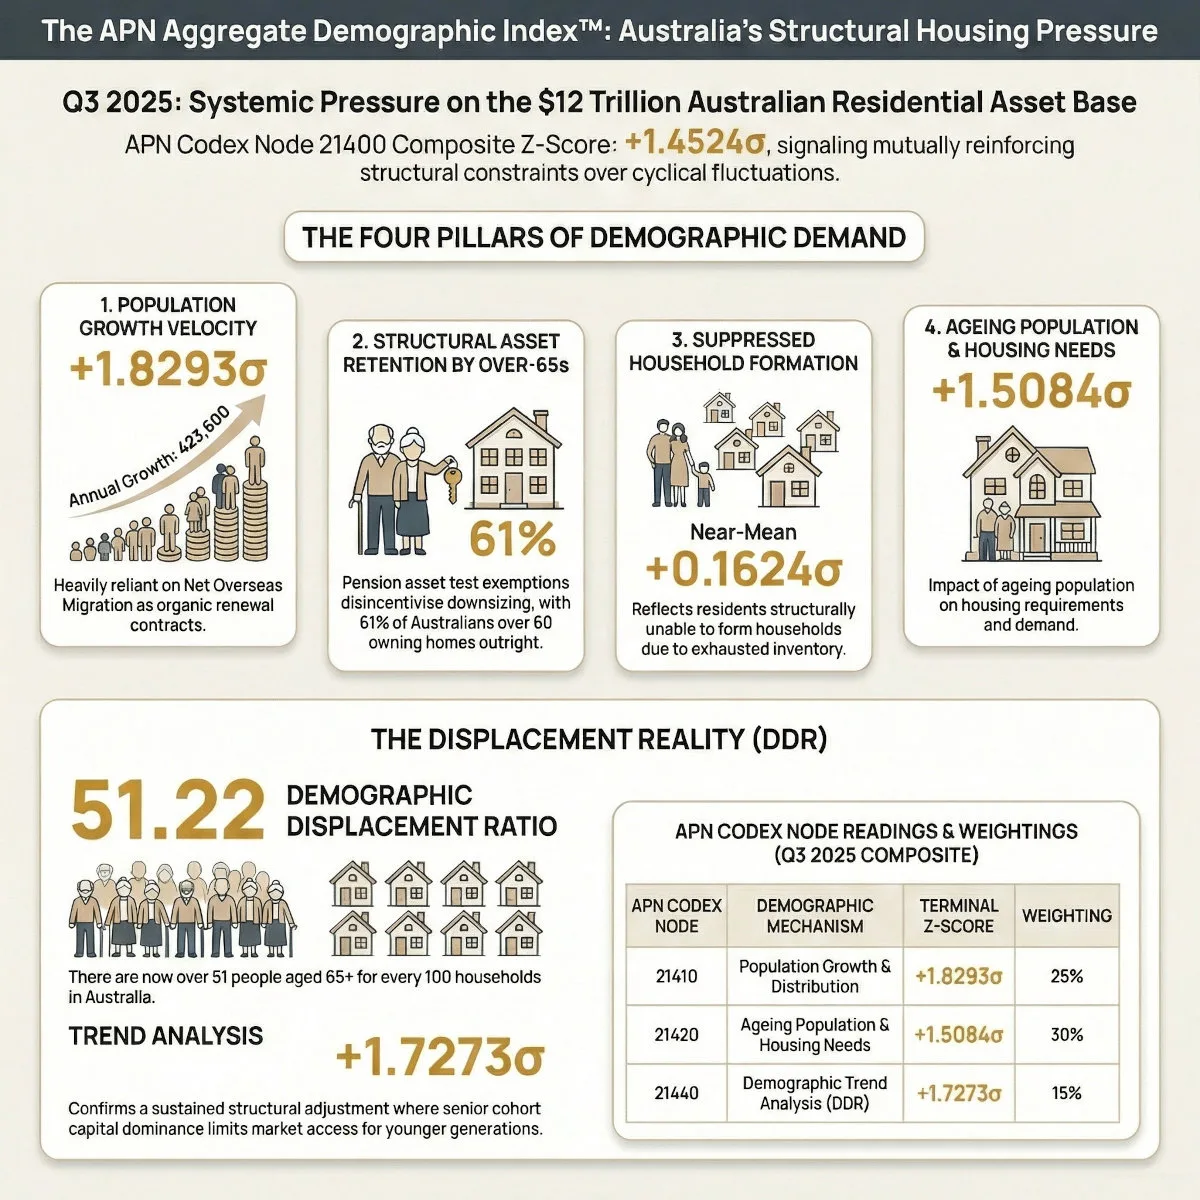
The APN Aggregate Demographic Index™ (21400) synthesises four certified subordinate nodes, each measuring a distinct demographic mechanism, into a single composite Z-Score anchored to a 15-year historical baseline. The certified Q3 2025 composite reading is +1.4524σ, operating under a ratified weighting structure of 30/30/25/15 formally adopted by APN governance in March 2026.
That figure represents a condition of elevated systemic pressure. But understanding what it means requires understanding what each of the four contributing nodes is actually measuring, and why no single node can tell the complete story.
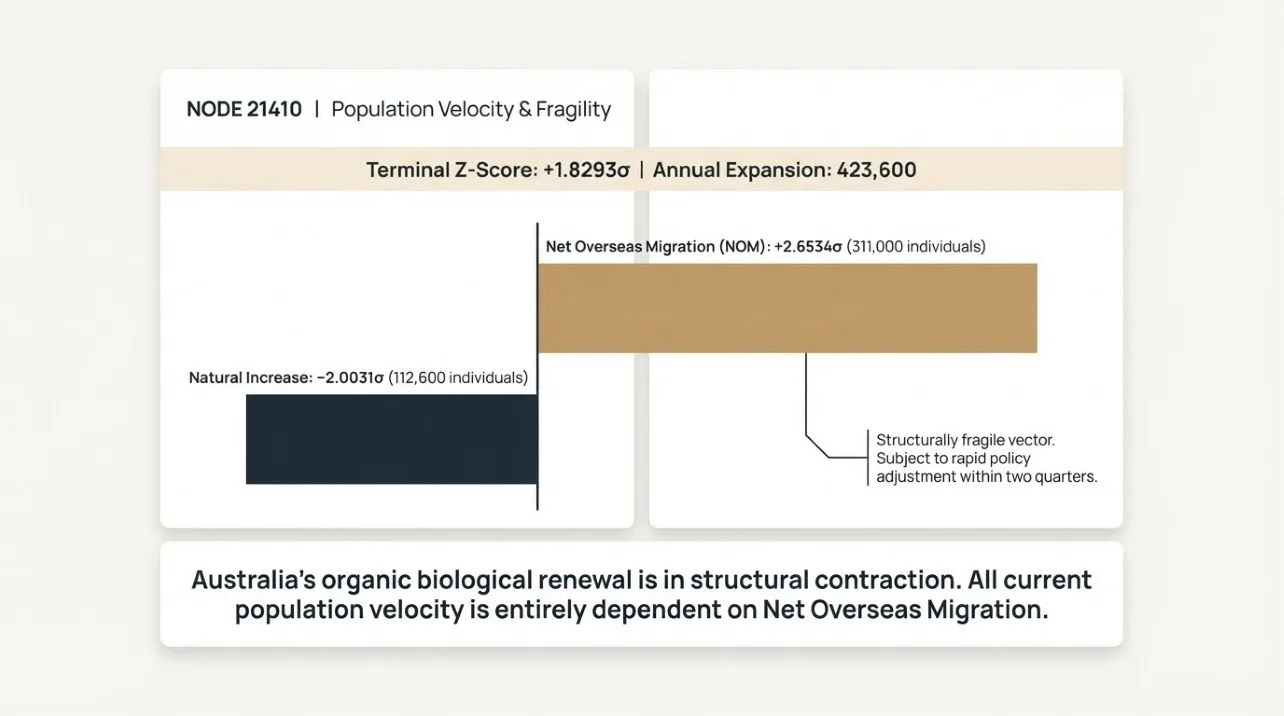
Node 21410 — Population Growth & Distribution (Terminal Z-Score: +1.8293σ)
Population Growth & Distribution (21410) measures the raw volumetric intake of human capital into the national substrate, births minus deaths, plus Net Overseas Migration (NOM), plus Net Interstate Migration (NIM). At Q3 2025, the Estimated Resident Population recorded an annual expansion of 423,600 individuals, generating the composite’s highest Z-Score at +1.8293σ.
But the internal composition of this node contains a critical structural divergence. Of that 423,600 annual growth, NOM contributed 311,000; the organic natural increase contributed only 112,600. The Natural Increase sub-component sits at a terminal Z-Score of −2.0031σ, confirming that domestic biological renewal is in structural contraction.
Australia’s organic population renewal is declining. All current population growth is structurally dependent on Net Overseas Migration, a vector that contracted to −2.5966σ during the pandemic trough of Q3 2020 and surged to +2.6534σ in Q1 2023. A single policy adjustment can materially alter this vector within two quarters. This is why Population Growth & Distribution (21410), despite recording the highest raw Z-Score in the composite, receives a 25% weighting rather than a higher allocation. The demand signal is real. It is also structurally fragile in a way that retained equity and capital asymmetry simply are not.
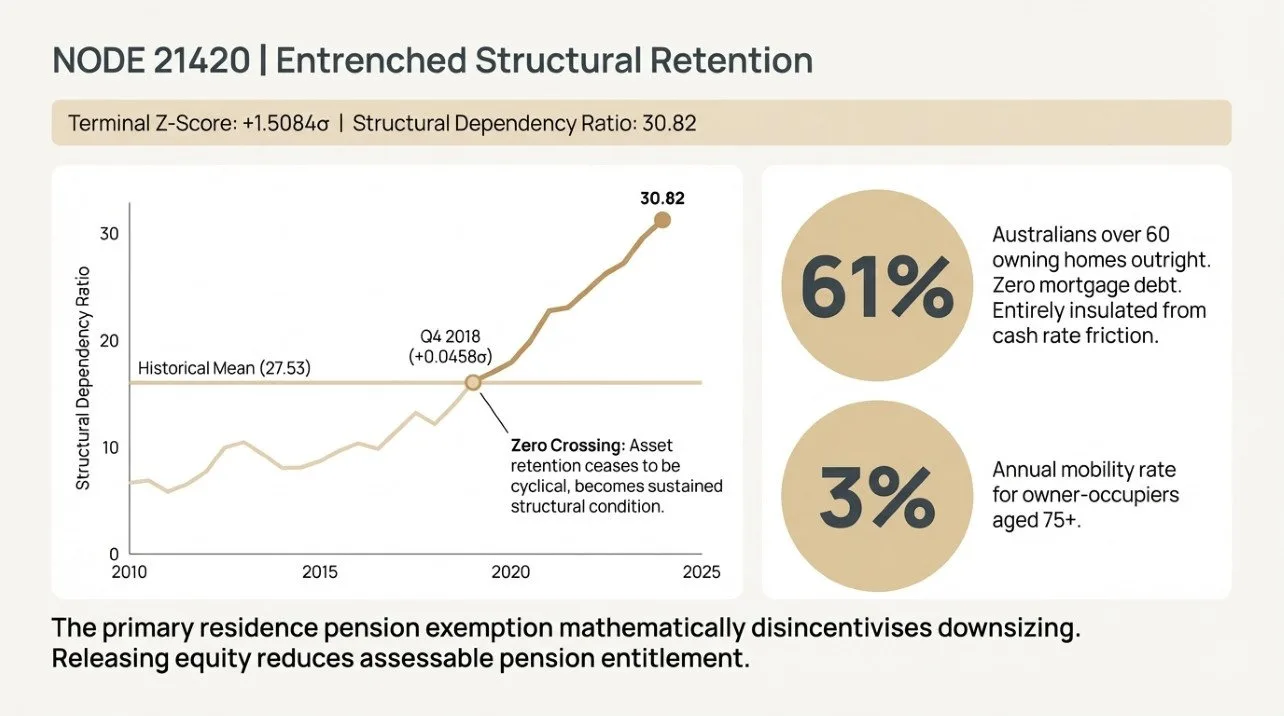
Node 21420 — Ageing Population & Housing Needs (Terminal Z-Score: +1.5084σ)
Ageing Population & Housing Needs (21420) measures the Structural Dependency Ratio (SDR), the proportion of the over-65 cohort against the working-age population aged 15 to 64. At +1.5084σ, with a terminal SDR reading of 30.827 against a 15-year historical mean of 27.5285, it confirms a phase of material structural adjustment that cannot be resolved by monetary policy.
The mechanism is the Age Pension assets test exemption. Because the primary residence is excluded from pension eligibility calculations, it is economically rational for older Australians to hold their wealth in their home rather than liquidate it. Releasing equity into assessable cash mathematically reduces pension entitlement. The sovereign architecture actively disincentivises the very market behaviour—downsizing—that would release secondary supply.
AHURI longitudinal data confirms that the annual mobility rate for owner-occupiers aged 75 and over is approximately 3%. RBA data confirms that 61% of Australians over 60 own their homes outright with zero mortgage debt. This cohort is entirely insulated from cash rate friction. Rate increases that meaningfully constrain younger buyers have no equivalent effect on the incumbent demographic holding established stock.
The zero crossing for this node occurred in Q4 2018 at a Z-Score of +0.0458, the precise quarter when asset retention by the ageing demographic ceased to be a cyclical variation and became a sustained structural condition. It has not looked back since. The node receives a 30% weighting in the composite, reflecting conditions that are structurally entrenched and policy-resistant in a way that population velocity is not.
Node 21430 — Household Formation Trends (Terminal Z-Score: +0.1624σ)
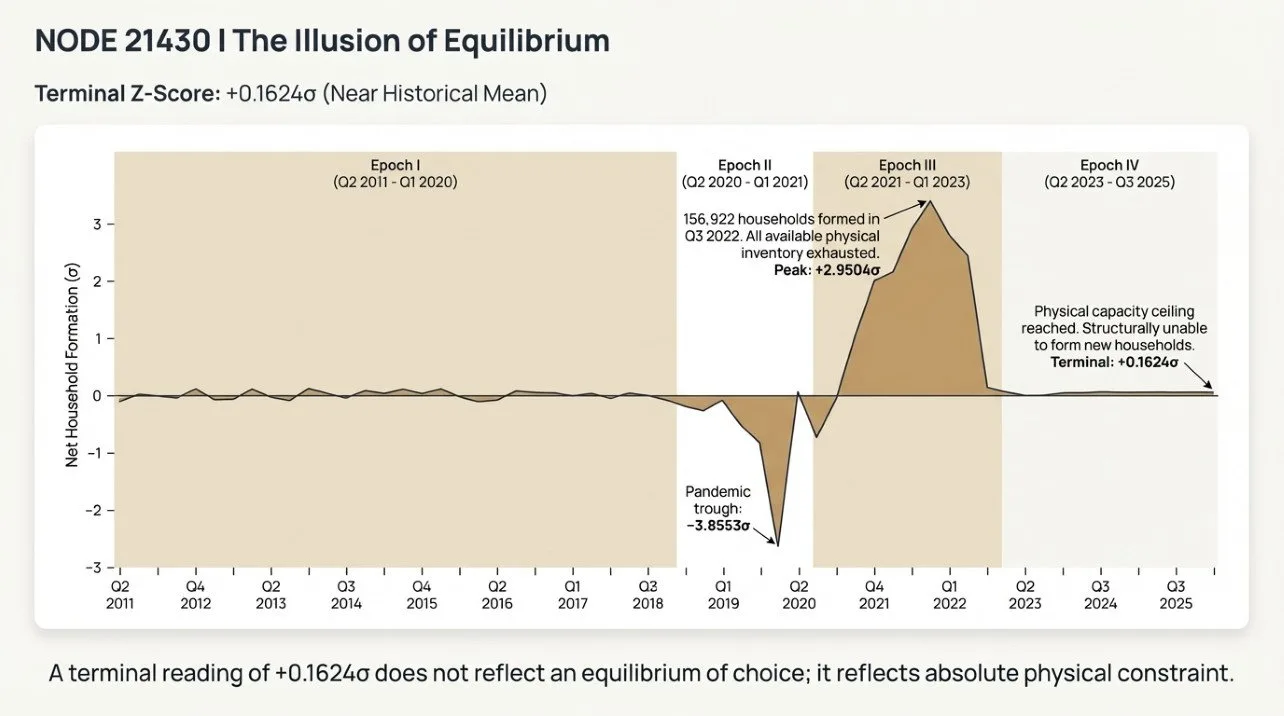
This is the node that requires the most careful clinical interpretation. A terminal Z-Score of +0.1624σ sits almost exactly at the 15-year historical mean, derived from a terminal Net Formation of 47,187.69 units against a baseline mean of 40,794.95. On face value, it implies a market in baseline equilibrium. It does not.
The history of this node tells a different story. The four epochs of the 15-year baseline are an essential context.
Epoch I, covering Q2 2011 to Q1 2020, was a prolonged period of structural stability. Formation oscillated within roughly half a standard deviation of the mean in either direction. The construction pipeline absorbed demand in step. Structural equilibrium was maintained across 37 consecutive quarters.
Epoch II, from Q2 2020 to Q1 2021, was the pandemic-induced demand constraint. Border closures forced household consolidation. Average Household Size reversed its decade-long decline, rising to 2.57 by Q3 2020. Net Formation reached −110,950 units, a certified pandemic trough of −3.8553σ in Q3 2020.
Epoch III, from Q2 2021 to Q1 2023, was the most structurally disruptive phase in the entire 15-year baseline. Remote work arrangements and elevated household savings drove rapid de-densification. Average Household Size contracted sharply to 2.48. Formation peaked at +2.9504σ in Q3 2022, with 156,922 new households formed in a single quarter. All available physical capacity was consumed. The National Housing Supply and Affordability Council confirmed that net housing completions fell short of newly formed households by approximately 68,000 in a single operating year. Total dwelling commencements for Q3 2025 reached only 48,778 nationally, a figure that cannot absorb the compounded latent demand generated during that period.
Epoch IV, from Q2 2023 to Q3 2025, is the capacity-constrained reversion. As inventory was exhausted and the RBA cash rate reached 4.35%, the market reconsolidated. Average Household Size reverted to 2.54. The terminal reading of +0.1624σ does not reflect residents choosing not to form new households; it reflects residents structurally unable to do so.
The near-mean terminal reading receives a 15% weighting in the static composite, not because the latent demand it represents is immaterial, but because the forward kinetic risk of that demand releasing is correctly housed in the APN Regulatory Velocity Multiplier™ (APN RVM™) (24210), which measures the velocity of formation acceleration rather than its absolute level. The static baseline diagnoses current structural reality. The 24000 Series forecasts what happens when the constraint lifts.
Node 21440 — Demographic Trend Analysis (Terminal Z-Score: +1.7273σ)
Demographic Trend Analysis (21440) is the synthesising node of the series. It resolves the analytical gap that the three upstream nodes cannot fill individually: it measures the structural consequence of the ageing cohort and the household formation cohort operating simultaneously on the same finite pool of physical dwellings.
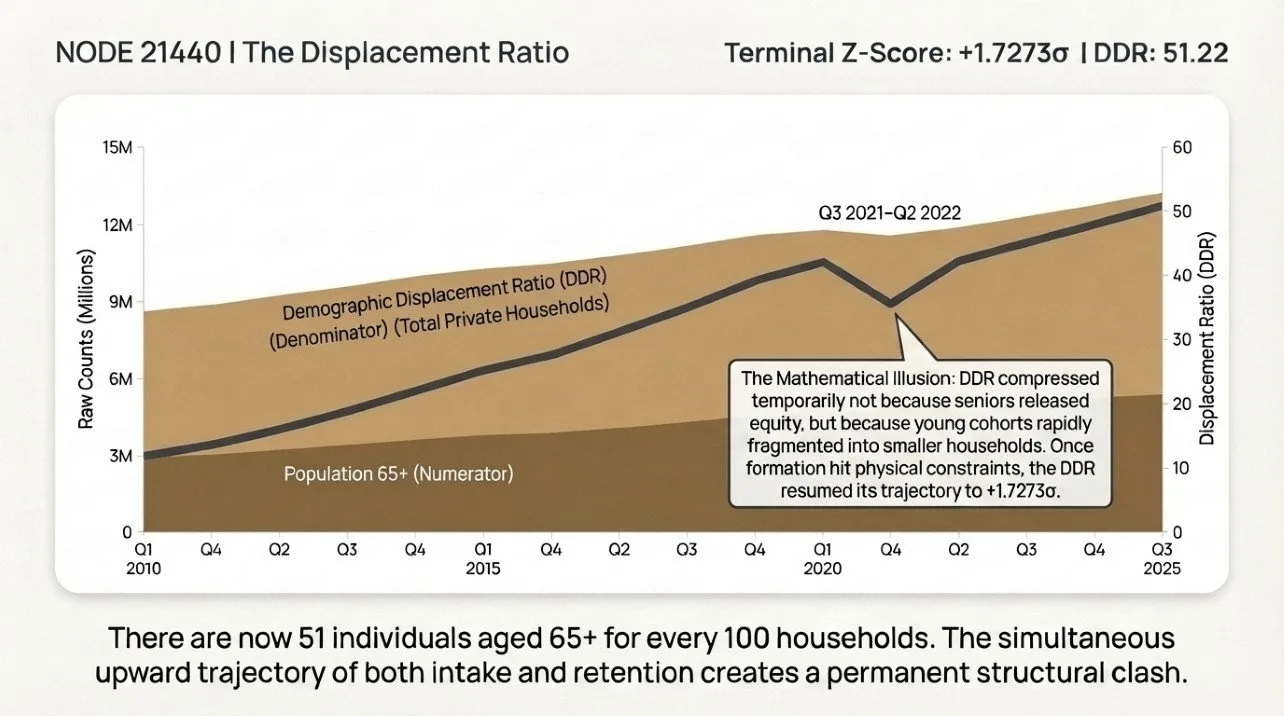
The APN Demographic Displacement Ratio (DDR) expresses the number of individuals aged 65 and over per 100 total private households. It is constructed via the V9.1 Fusion Engine, combining the certified Pop_65_Plus series from Ageing Population & Housing Needs (21420) with the Total_Households series from Household Formation Trends (21430). At Q3 2025, the DDR stands at 51.22, meaning there are now more than 51 people aged 65 or over for every 100 households in Australia. The 15-year historical mean was 45.46. The terminal Z-Score of +1.7273σ confirms this is a structurally elevated, sustained condition.
The DDR crossed zero in Q4 2018 at +0.0303σ, just two quarters after Population Growth & Distribution (21410) crossed zero in Q2 2018. This near-simultaneous inflection is the compound origin point of the current structural condition: the precise historical juncture where both the volume of demographic intake and the capital asymmetry of the incumbent cohort transitioned simultaneously from below-mean to above-mean.
The most analytically significant feature of the entire 21400 series is what happened between Q3 2021 and Q2 2022. During the Epoch III household formation surge, the DDR temporarily compressed from +1.1479σ to +0.8746σ. Taken in isolation, Demographic Trend Analysis (21440) appeared to show a reduction in capital dominance by the senior cohort. Household Formation Trends (21430) appeared to show extraordinary absorption capacity at +2.9504σ. Both readings were technically accurate. Both were structurally misleading in isolation.
The aggregate composite reveals what actually occurred: the household formation surge expanded the DDR denominator, total private households, faster than the DDR numerator; the over-65 population grew, temporarily compressing the ratio. The compression was not a reduction in capital asymmetry. It was younger cohorts rapidly fragmenting into smaller living arrangements and competing for the same scarce inventory that the incumbent demographic continued to hold. Once the formation surge hit physical constraints and the denominator stalled, the DDR resumed its trajectory to +1.7273σ. Neither node could identify this dynamic in isolation. The composite could.
The Composite Signal and What It Confirms
Three of the four subordinate nodes are operating above +1.5σ. The fourth, Household Formation Trends (21430) at +0.1624σ, represents structurally suppressed demand rather than genuine equilibrium. The ratified composite of +1.4524σ is conservatively stated: the 15% weighting assigned to the suppressed node mathematically anchors the aggregate downward relative to what a structure reflecting structural durability alone would produce.
What the composite confirms at Q3 2025 is a residential asset base operating under a set of mutually reinforcing constraints. Population velocity at +1.8293σ is entering a market where stock is structurally retained by an ageing cohort at +1.5084σ that is simultaneously expanding its proportional claim on the total physical housing pool at +1.7273σ, while the cohort that would normally absorb new supply through household formation is physically and financially prevented from doing so at +0.1624σ. These are not independent conditions. They are a compound structural reality.
Downstream Consequences – 24000 Series Interfacing
The +1.4524σ composite feeds directly into three downstream APN proprietary indices.
The APN Regulatory Velocity Multiplier™ (APN RVM™) (24210) quantifies the speed and intensity of state-led regulatory interventions. The composite confirms that elevated population velocity is simultaneously colliding with suppressed formation capability and structural asset retention. This compound condition creates the precise socio-economic displacement that drives sovereign intervention, rental price caps, up-zoning overrides, negative gearing architecture adjustments. The RVM™ ingests the first derivative of Net Formation velocity to forecast when and where these interventions are most probable, with the latent demand release signal feeding directly into the adverse policy shift probability matrix.
The APN Residual Land Value Gap™ (24410) calculates the financial viability gap between land vendor price expectations and a commercial developer’s capacity to construct profitably. The bifurcated demand composition, formation-suppressed younger cohorts on one side, capital-rich senior cohorts on the other, structurally incentivises developers to pivot toward premium typologies targeting the affluent downsizer. This recursive feedback loop widens the viability gap for affordable supply, as premium-focused developers structurally displace affordable housing developers from scarce development sites. The APN Replacement Cost Gap™ (24450) compounds this by rendering the construction of affordable new supply commercially unviable under current input cost conditions.
The APN Sovereign Policy Composite Index™ (SPCI) (24800) aggregates and weighs the net impact of all state-level market interventions. The +1.4524σ composite confirms that a dominant portion of the demographic substrate operates entirely outside standard monetary policy transmission. With 61% of Australians over 60 owning their homes outright, the SPCI must recalibrate the theoretical impact of rate adjustments accordingly, confirming that sovereign regulatory architecture rather than free-market credit cycles is now the primary mechanism governing long-term asset trajectories.
Testing the Null Hypothesis
The standard counter-argument holds that the structural friction generated by the over-65 cohort is a temporary condition, that downsizing, aged care transitions, and estate liquidation will eventually recycle established stock back into the secondary market and relieve the structural pressure. Testing this hypothesis against verified Tier-1 institutional data produces a clear result.
ABS Census Longitudinal Dataset data confirms that only 16% of Australians aged 65 and over moved residences within a five-year period, against a 38% mobility rate for the younger adult demographic. AHURI longitudinal data confirms the mobility rate for owner-occupiers aged 75 and over is approximately 3% annually. When transitions do occur, AHURI research confirms three bedrooms remains the preferred downsizing configuration; the net volumetric gain to the broader market is negligible. Downsizing transfers structural underutilisation from a detached suburban home to a premium townhouse or apartment. It does not generate functional new supply.
The APN Replacement Cost Gap™ (24450) establishes a structural price floor that renders downsizing financially unviable for a significant portion of the cohort. The cost of acquiring an appropriate newly constructed townhouse or apartment frequently equals or exceeds the unencumbered market value of the senior cohort’s existing detached home. They are not choosing to stay. The economics mandate it.
ABS longitudinal data confirms the median age for transition from private dwellings to non-private aged care has extended to 86 years. The timeline for organic stock release continues to lengthen, not shorten.
The null hypothesis is definitively rejected. The acceleration of the APN Demographic Displacement Ratio from −1.6475σ in Q1 2011 to a certified terminal reading of +1.7273σ in Q3 2025 does not represent a transient demographic anomaly. It mathematically confirms a sustained structural adjustment within the Australian residential asset base.
Clinical Conclusion: Structural Demand Conditions at Q3 2025
The certified composite Z-Score of +1.4524σ confirms that the demand-side demographic mechanics of the Australian residential asset base are operating under sustained, compound structural constraint at the Q3 2025 terminal point. Population velocity, ageing equity retention, formation suppression, and intergenerational capital asymmetry are not independent cyclical variables; they are mutually reinforcing structural conditions.
The four certified subordinate nodes collectively confirm that physical supply delivery cannot organically scale to meet structural requirement under current conditions. Until sovereign regulatory architecture materially adjusts the policy incentives driving structural equity retention, the residential asset base will remain characterised by elevated systemic displacement, sustained valuation resilience, and a mathematically constrained restriction of market access for non-incumbent cohorts.
APN Codex Node 21400 · Demographic Analysis (APN Aggregate Demographic Index™) · Certified Q3 2025 · Composite Z-Score +1.4524σ · Ratified Weighting 30/30/25/15 · Baseline Q1 2011 – Q3 2025 · Australian Property Network